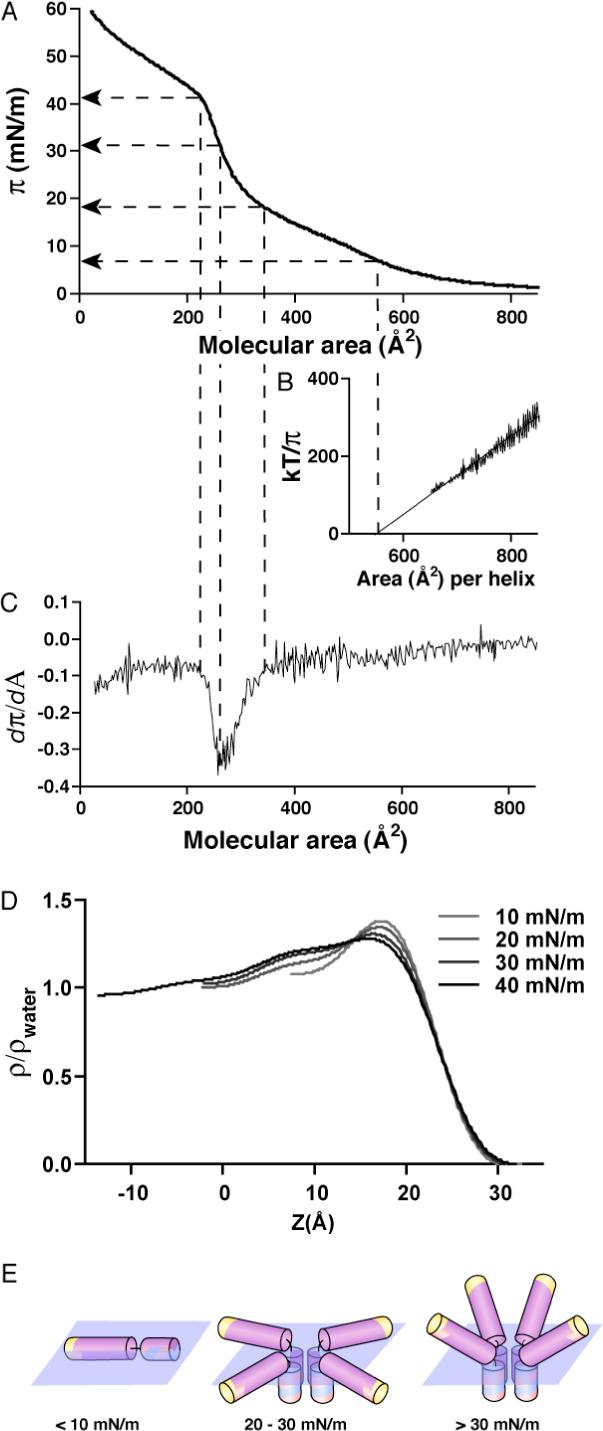
Figure 4.

Orientation of AP1 at the air-water interface. (A) Pressure (π) - area (A) isotherm of apo-AP1 at 24 °C with water as a subphase. (B) kT/π versus A. The linear relationship indicates that the AP1 behaves as an ideal 2D gas at very low “2D concentration” (high molecular areas). The fit of the experimental points with linear equation kT/π = n(A - A0) yields n = 1.04 ± 0.03 and A0 = 552 ± 25 Å2. (B) Derivative of the π - A isotherm shown in (A) provide information on the changes in compressibility of the film. (C) Electron density profiles of the apo-AP1 monolayer at four different pressures (see methods and references). (D) Model of AP1 behavior based on the isotherm and the electron density profiles.
