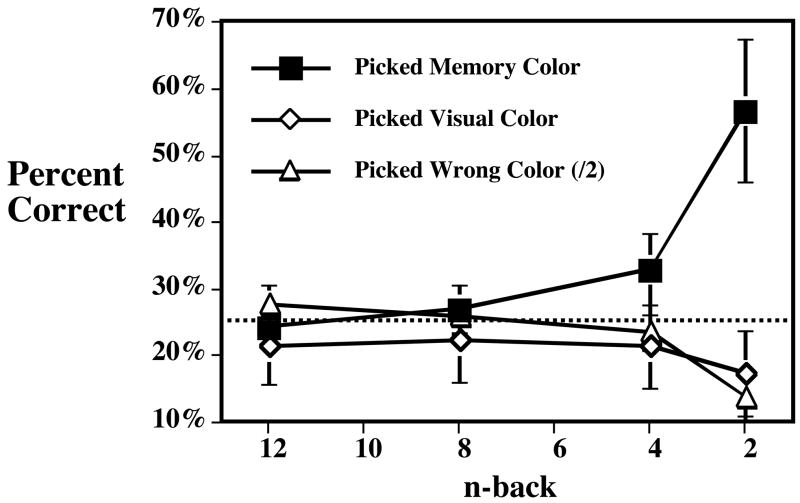
Figure 7.
Results of Experiment Five. Because chance level for Wrong responses is 50%, Wrong response rates are divided by 2 to make them comparable to the Memory and Visual responses, each of which has a chance probability of 25%. Error bars are 95% confidence intervals. As before, the most recently cued items are to the right of the graph.

