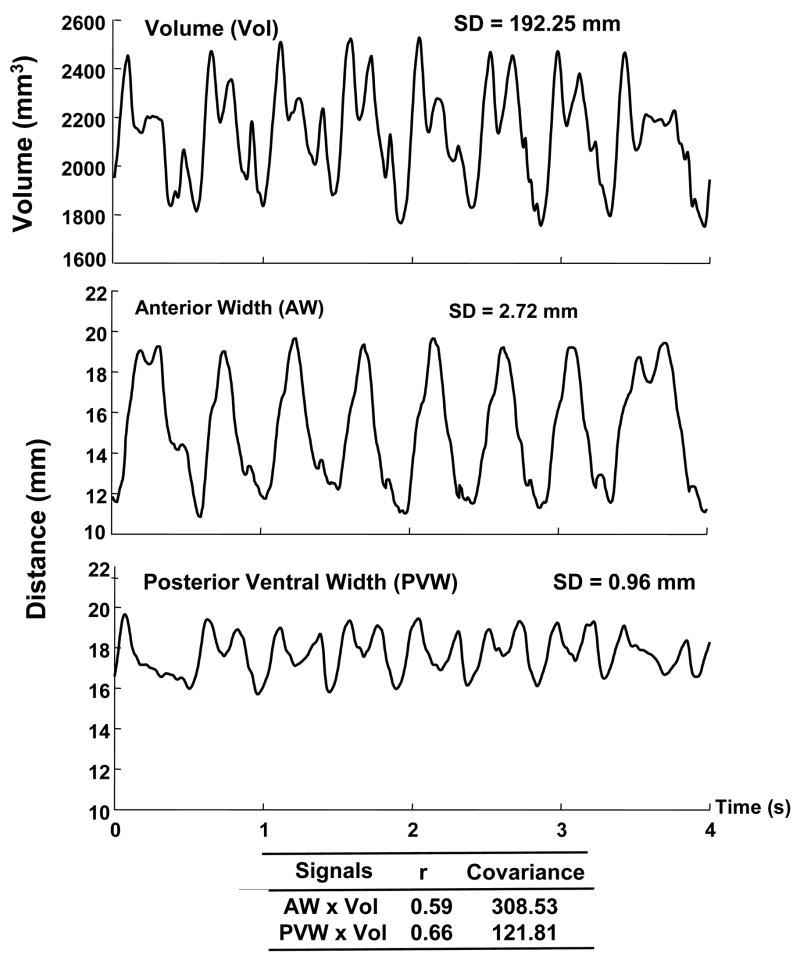
Fig. 4.
To quantify the contribution of dimensional changes (as represented by the distance between each crystal pair) to tongue volume changes, covariance was computed between each distance and volume time-histories. The time-histories for the volume (Vol), anterior width (AW), and posterior ventral width (PVW) for a single masticatory sequence from the pig #1 are displayed in the top, middle, and bottom panels, respectively. The figure shows that the magnitude of change in distance was greater for AW than it was for PVW (SD = 2.72 vs 0.96, respectively), but the coupling between each crystal pair and volume were similar (rAW × Vol = 0.59 and rPVM × Vol = 0.66). Consequently, the covariance was much larger for AW than for PVW. In contrast to the correlation analysis, the covariance analysis provided a means to distinguish between dimensions that exhibited small distance changes during chewing from those that exhibited large ones; presumably, dimensions with large distance changes would contribute more to volumetric changes than those with small distance change.

