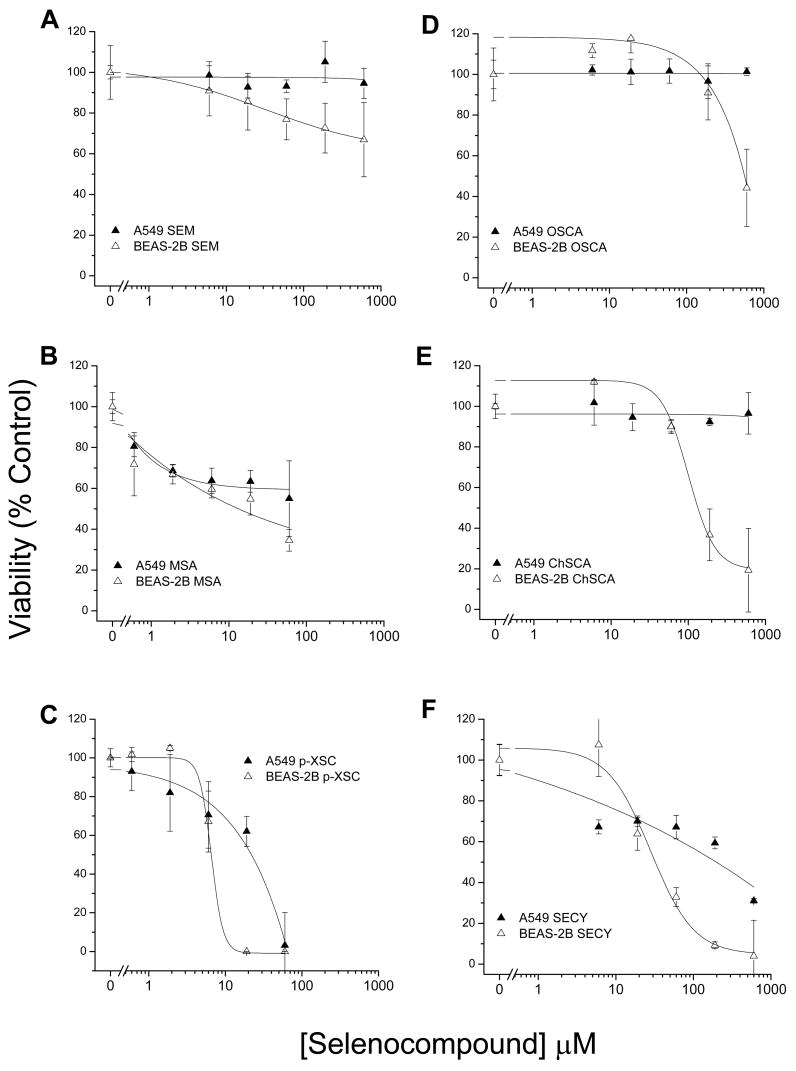
Figure 1. Human lung cell line viability following treatment with selenocompounds.
Dose response curves for A549 cells (filled triangles) and BEAS-2B cells (open triangles) treated with; (A) SEM, (B) MSA, (C) p-XSC, (D) OSCA, (E) ChSCA, and (F) SECY for 24 hrs. p-XSC and MSA were evaluated at concentrations between 0 to 60 μM while all other selenocompounds were evaluated at concentrations between 0 to 600 μM. Symbols represent the mean viability of triplicate measures as a percentage of control with standard deviations.

