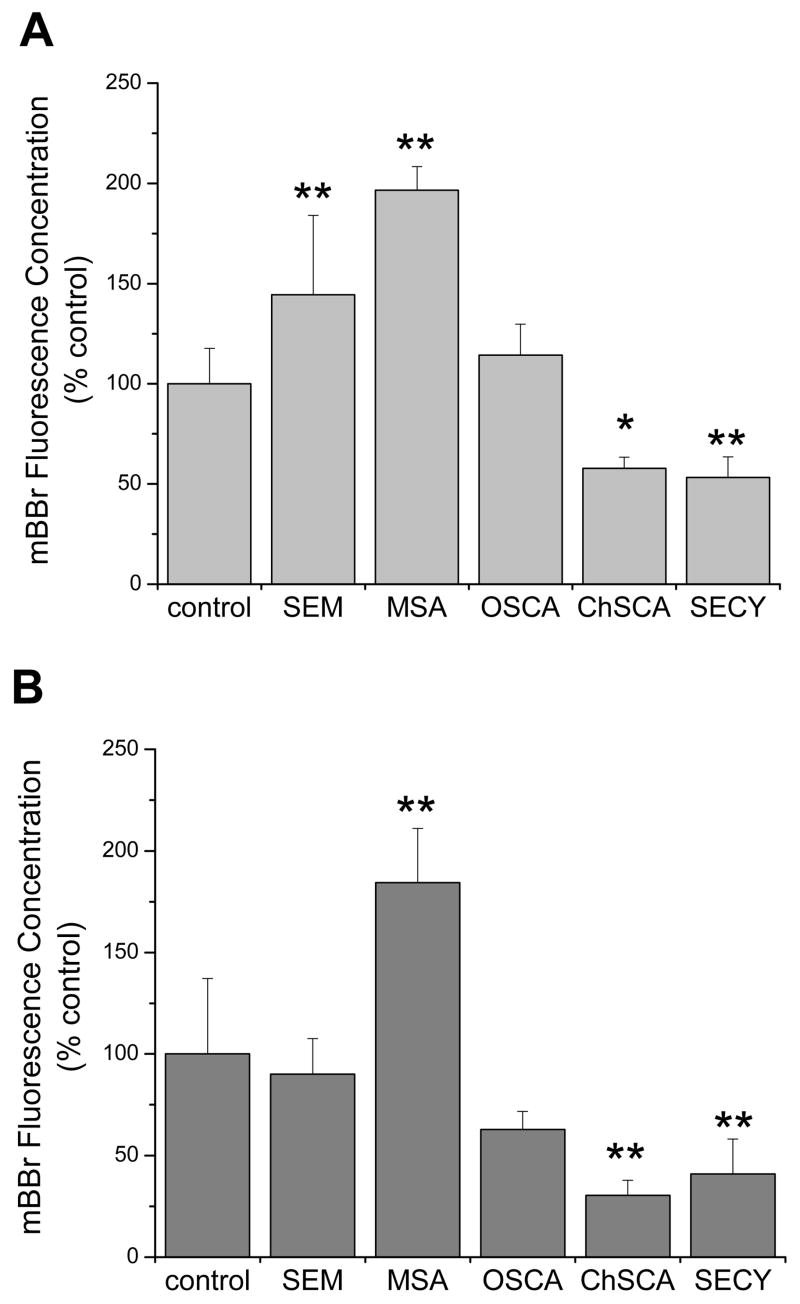
Figure 2. Thiol status following treatment with selenocompounds in human lung cells.
Analysis of (A) A549 cells and (B) BEAS-2B cells using the fluorophore mBBr as a measure of cellular thiol status. Cells were incubated with 40 μM mBBr for 5 min prior to cytometric analysis. Selenocompounds were used at concentrations that resulted in less than 25% decreases in viability. Concentrations used were: SEM, 100 μM; OSCA, 100 μM; MSA, 5 μM (A549) or 2.5 μM (BEAS-2B); ChSCA, 100 μM (A549) or 50 μM (BEAS-2B); SECY, 100 μM (A549) or 25 μM (BEAS-2B). Bars represent the mean mBBr fluorescence concentrations normalized to the control with standard deviations. The control mean mBBr fluorescence concentrations were 0.267 and 0.203 with coefficient of variation of 13% and 12% for A549 and BEAS-2B, respectively. Samples with significant differences from the control are marked with asterisks: *, P<0.05; **, P<0.01.

