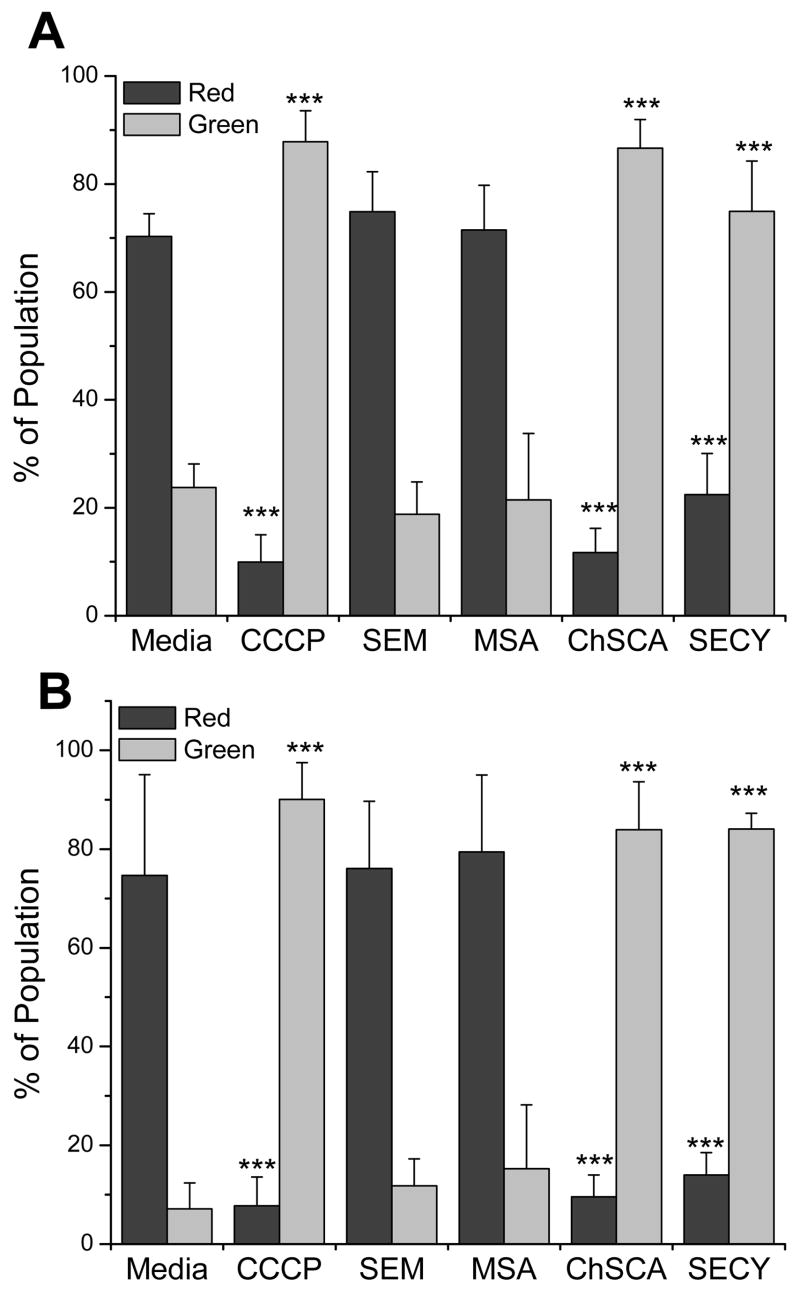
Figure 4. Depolarization of mitochondrial membrane potential by selenocompounds.
Analysis of (A) A549 cells and (B) BEAS-2B cells using the mitochondrial fluorophore JC-1 to cytometrically measure the mitochondrial membrane potential. CCCP (25 μM), a recognized mitochondrial membrane potential disrupter, was utilized as a positive control. Cells were incubated with selenocompounds for 24 hrs and the concentrations of the compounds used were: SEM, 100 μM; MSA, 5 μM; ChSCA, 200 μM (A549) or 100 μM (BEAS-2B); SECY, 100 μM (A549) or 50 μM (BEAS-2B). Bars represent the percentage of the cellular population with polarized mitochondria as indicated by red fluorescence (525 nm) or depolarized mitochondria as indicated by green fluorescence (575 nm) with standard deviations. Treatment with CCCP, ChSCA, and SECY resulted in a significant difference from control, (***, P<0.001).

