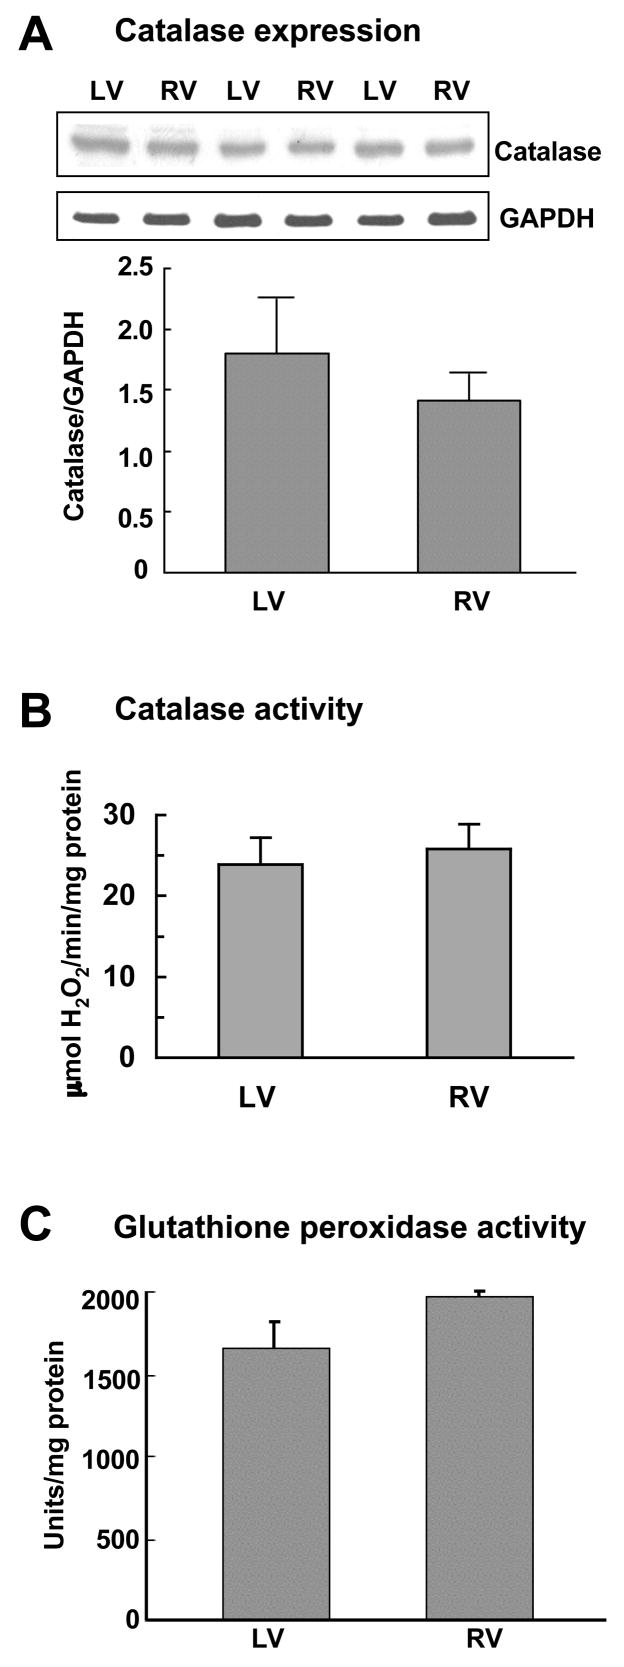
Fig. 3. H2O2 scavenging activity in right and left ventricles.
Right (RV) and left (LV) ventricular walls were dissected and homogenized. (A) Protein expression levels of catalase (65 kDa) and loading control GAPDH (37 kDa) were monitored by immunoblotting. (B) Catalase activity was measured spectrophotometrically. (C) Glutathione-dependent peroxidase activity was monitored spectrophotometrically. Bar graphs represent means ± SEM (n = 3 – 6).

