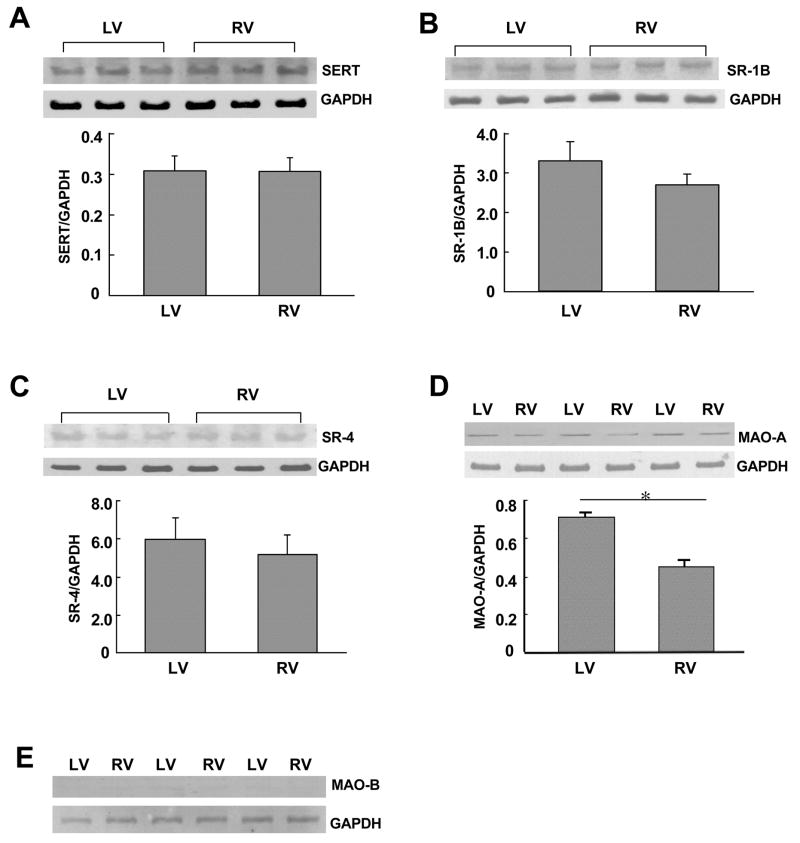
Fig. 4. Expression of 5-HT regulatory proteins in right and left ventricles.
Right (RV) and left (LV) ventricular walls were dissected and homogenized. The samples were subjected to immunoblotting with (A) 5-HT transporter (SERT; 70 kDa), (B) 5-HT1B receptor (SR-1B; 42 kDa), (C) 5-HT4 receptor (SR-4; 43 kDa), (D) MAO-A (61 kDa), and (E) MAO-B (60 kDa). Levels of GAPDH (37 kDa) were also monitored. The bar graph represents means ± SEM (n = 3 – 5). (*) denotes values significantly different from each other at P < 0.05.

