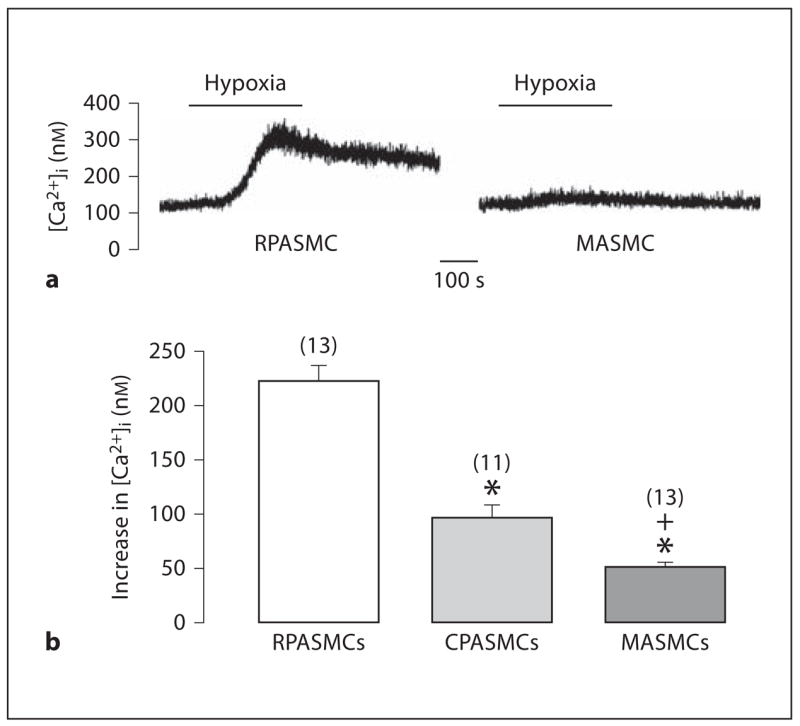
Fig. 6.

Hypoxia-induced increases in [Ca2+]i are different in mouse RPASMCs, CPASMCs and MASMCs. a Representative traces show hypoxia-induced increase in [Ca2+]i in an RPASMC and MASMC. b Graph summarizes hypoxic Ca2+ responses in RPASMCs, CPASMCs and MASMCs. * p < 0.05 compared with RPASMCs; + p < 0.05 compared with CPASMCs.
