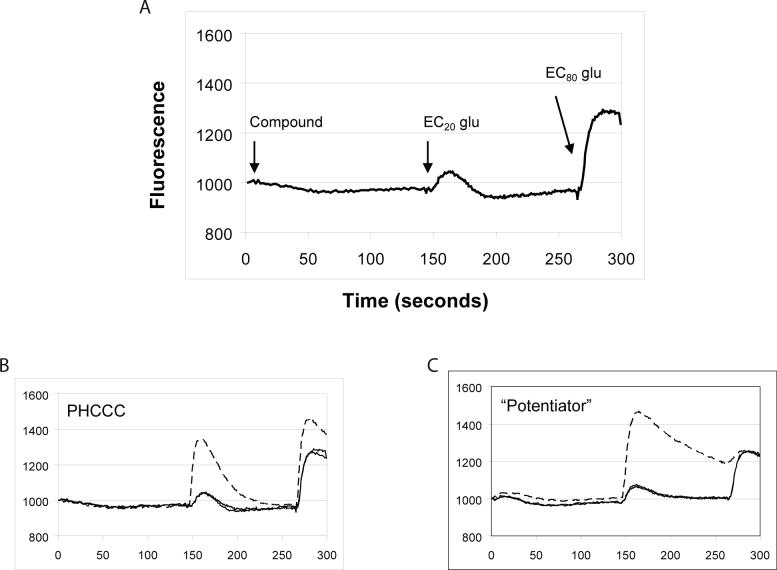
Figure 2. HTS assay design and fluorescence traces of potential mGluR4 PAMs measured during the HTS campaign.
A, HTS assay design. Human mGluR4/Gqi5 cells were loaded with Fluo-4 calcium-indicator dye as described in Materials and Methods. A baseline fluorescence measurement was taken for 3s and then either vehicle or a 10 μM concentration of compound was added. Approximately 2.5 minutes later (time 146s), an EC20 concentration of glutamate (2 μM final) was added followed at 266s by an EC80 concentration of glutamate (20 μM final). B and C, Representative traces of control compounds or compounds identified during HTS. B, Control trace measured in the presence (hatched line) or absence (solid line) of 10 μM PHCCC. C, Trace observed in the presence of a novel compound (hatched line) that potentiates the response of glutamate at mGluR4.

