
Figure 2.
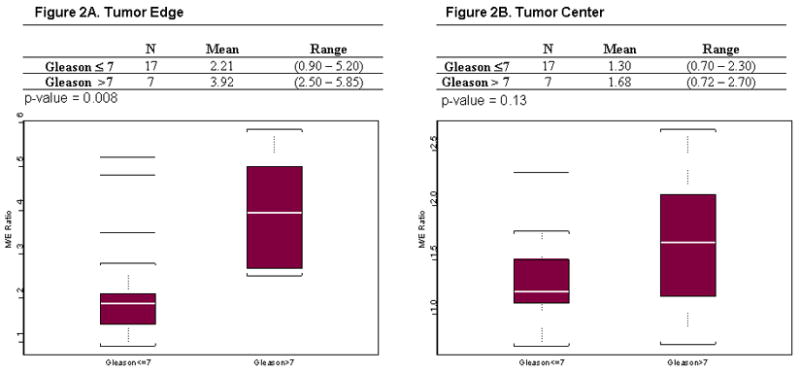
Box plots for M/E ratio assessed via IHC and stratified by Gleason score and location of intratumoral staining. A) M/E ratio measured at the tumor edge (P = 0.008 Gleason score > 7 significantly higher than Gleason score ≤7 prostate cancer). B) M/E ratio measured at the tumor center (P = 0.13, M/E ratio not significantly different by Gleason score at tumor center).