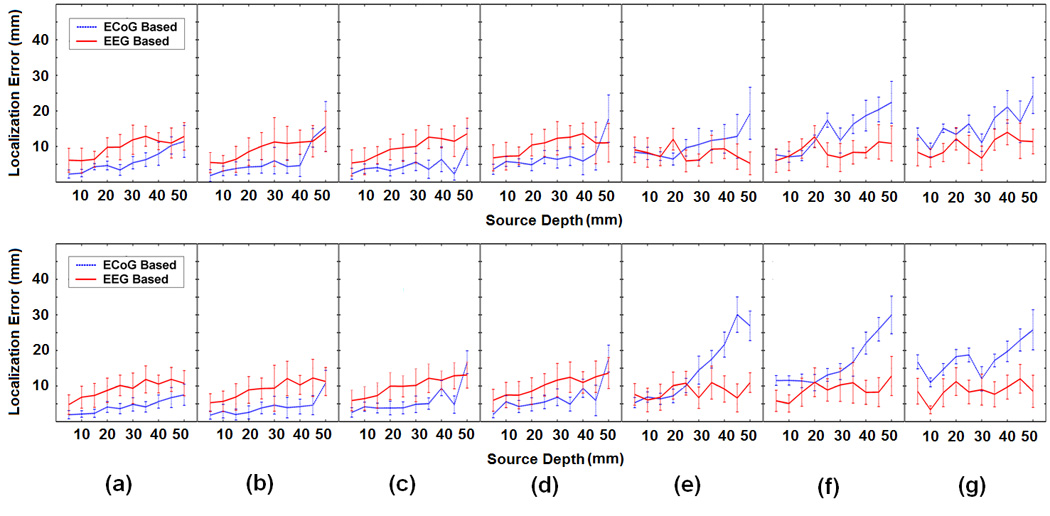
Fig. 3.

Comparison between the ECoG-CDR and the EEG-CDR in the case of a single dipole source. The subfigures (a), (b), (c), (d), (e), (f) and (g) respectively show the comparison results from the dipole group #1, #2, #3, #4, #5, #6 and #7 in the dipole configuration shown in Fig. 1(c), and every subfigure include one upper panel figure and one lower panel figure in which the united tangential and radial dipole moment are used in the comparison. In every subfigure, the horizontal axis refers to the depth of dipole from the cortical surface. The vertical axis indicates the localization error (mm) and the solid curves and the vertical dashed lines depict the change of the mean localization error and the standard deviation, respectively, as the dipole source depth changes from 5 mm to 50 mm below the cortical surface. The blue dashed and the corresponding vertical lines depict the results obtained by using the present ECoG-CDR method, and the red solid and the corresponding vertical lines depict the results obtained by using the EEG-CDR method.
