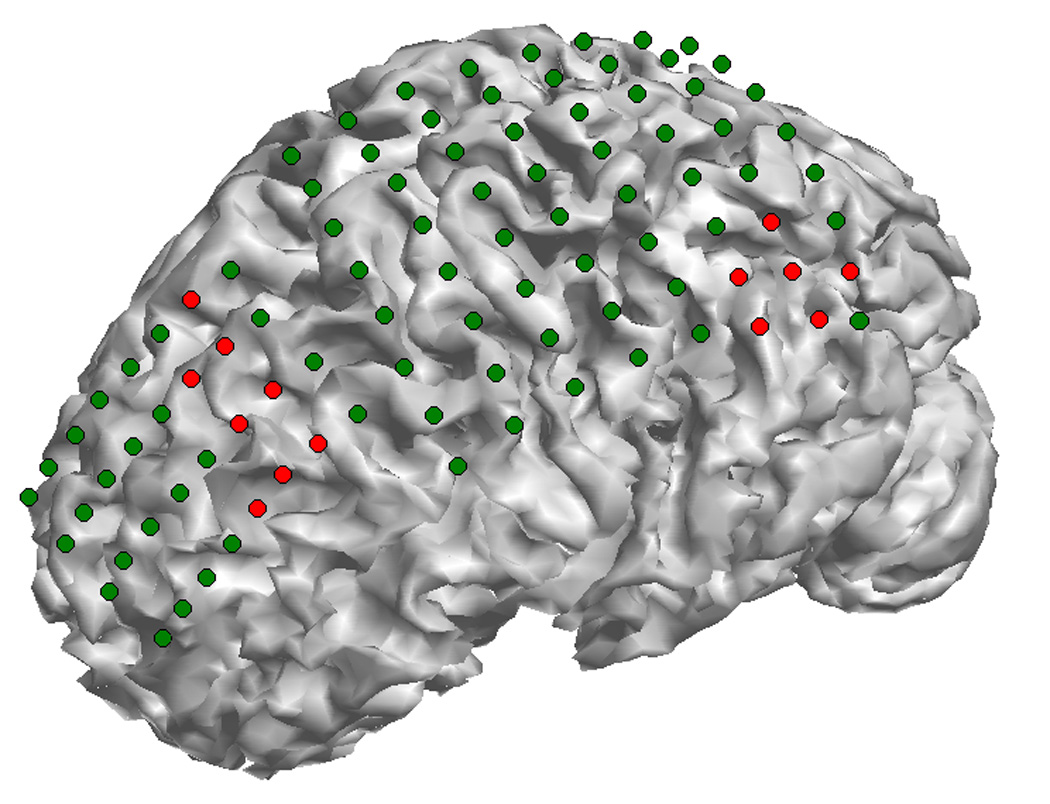
Fig. 7.

The epileptogenic zones of the epilepsy patient as identified from ictal ECoG recordings. The dots on the cortical surface show the ECoG grids segmented from CT images, and the red ones show the epileptogenic zones. Two ictal onset zones were identified in this patient: one is located at the left parietal lobe and the other one is located at the anterior frontal lobe.
