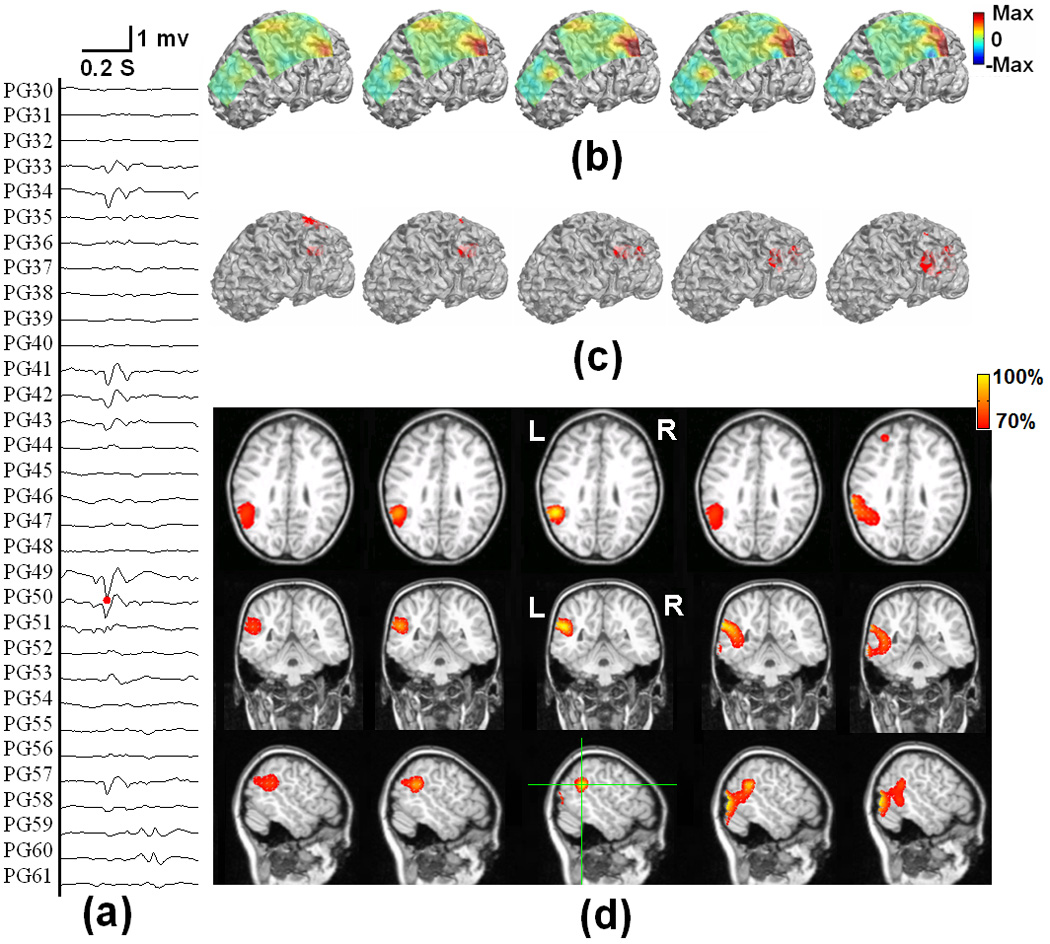
Fig. 9.

The tomography of the strengths of the current sources estimated by using the present ECoG-CDR method at different time points during an interictal spike at the left parietal lobe of a pediatric epilepsy patient, from 5 ms before and 5 ms after the peak of the spike. (a) The ECoG recordings measured directly from the frontal and parietal grids. (b) The potential maps of the ECoG recordings which were normalized to the maximal absolute value of the entire ECoG recordings over the frontal and parietal grids. (c) The reconstructed current density distribution obtained by using the present ECoG-CDR method in the 3-dimensional space with a threshold set at 70% of the maximum current density value. (d) The axial, coronal and sagittal views (from top to bottom row) of the strengths of the estimated current density, the green lines on the sagittal slice at interictal spike peak instant indicate the location of the axial and coronal views.
