
Figure 5.
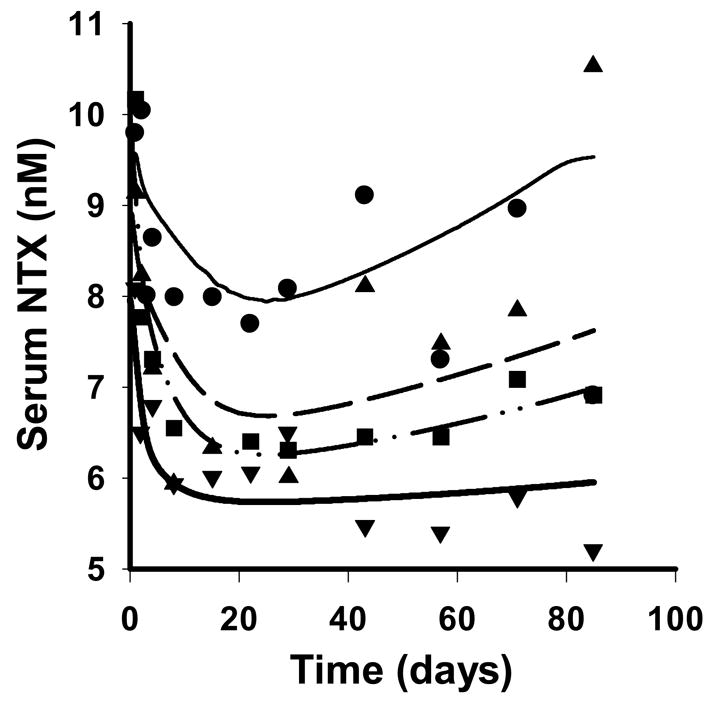
Serum NTX concentration-time profiles after simultaneously fitting the integrated cellular bone homeostasis model to the median data for four single SC doses. Symbols and lines are as defined in Figure 4.
Official websites use .gov
A
.gov website belongs to an official
government organization in the United States.
Secure .gov websites use HTTPS
A lock (
) or https:// means you've safely
connected to the .gov website. Share sensitive
information only on official, secure websites.
Serum NTX concentration-time profiles after simultaneously fitting the integrated cellular bone homeostasis model to the median data for four single SC doses. Symbols and lines are as defined in Figure 4.