
Figure 6.
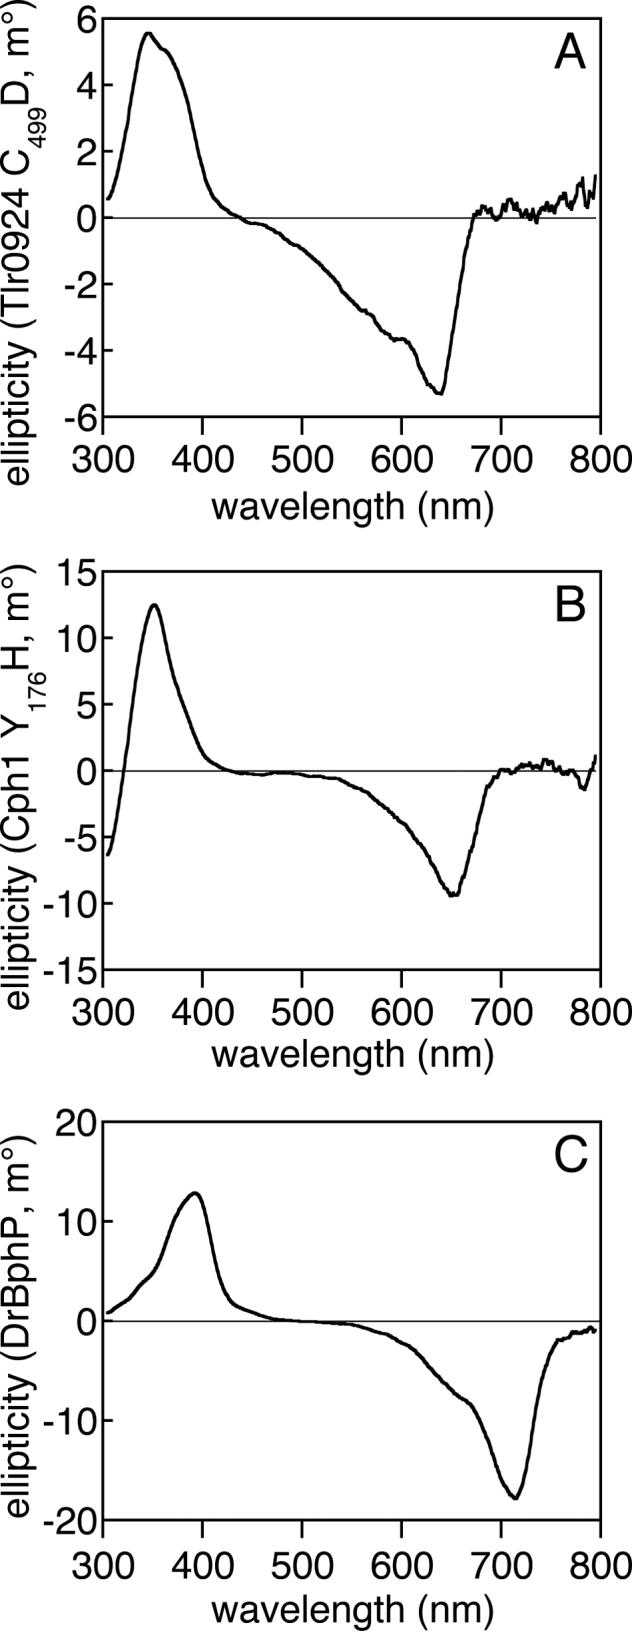
Comparison of the C499D mutant of Tlr0924 with phytochromes by CD spectroscopy. (a) The CD spectrum of C499D Tlr0924 (7.3 μM) exhibits negative rotation in the red absorbance band and positive rotation in the blue absorbance band. (b) The CD spectrum of Y176H Cph1 (3.6 μM) exhibits similar features, as has been previously reported for wildtype Cph1 in the Pr state (57). (c) The CD spectrum of DrBphP (4.4 μM) in the Pr state also exhibits similar features. All spectra are presented as the buffer-corrected, smoothed average of 3 scans at room temperature.