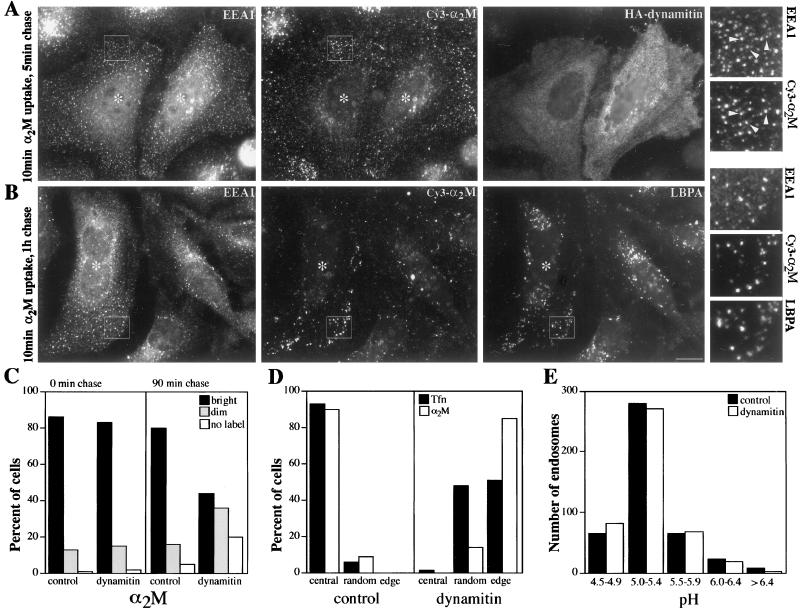
Figure 5.
Analysis of endocytic trafficking in control and dynamitin-overexpressing cells. (A) HeLa cells were labeled with Cy3-α2-M for 10 min and then chased for 5 min and fixed with paraformaldehyde. The same cells were then stained for early endosomes (EEA1; left) and overexpressed dynamitin (right); α2-M staining is shown in the middle. (B) As in A, except the cells were chased for 1 h after the α2-M pulse to allow the probe to traffic to late endosomes. After fixation, the cells were stained for EEA1 (left) and LBPA (right); α2-M staining is shown in the middle. For A and B, the small panels to the right are 3× magnification views of the boxed areas; cells overexpressing HA-dynamitin are marked with asterisks. Arrows in A indicate early endosomes that also stain for α2-M. (C) Qualitative analysis of α2-M uptake and accumulation. Transfected Cos7 cells were labeled for 20 min and then fixed immediately (left panel) or chased for 90 min and then fixed (right panel). The fluorescence intensity (bright, dim, or no label) of ≥150 cells was assessed for each condition. (D) Subcellular distribution of endosomes loaded with Tfn or α2-M. Transfected HeLa cells were loaded with fluorescent tracers, fixed immediately, and then scored for endosome location. Central, random, and peripheral indicate the site of the most predominant staining. Similar results were obtained in Cos7 cells (our unpublished results). (E) Analysis of endosome pH in transfected, live Cos7 cells. pH was measured by fluorescence ratio imaging (Kim et al., 1996). Data were acquired from at least two different coverslips in two independent experiments. Dynamitin overexpressers were identified by staining with anti-HA (A, B, and D) or pAb dynamitin (C) or by Golgi morphology (E).

