
Fig. 2. Effects of lopinavir (LPV) on eEF2 phosphorylation.
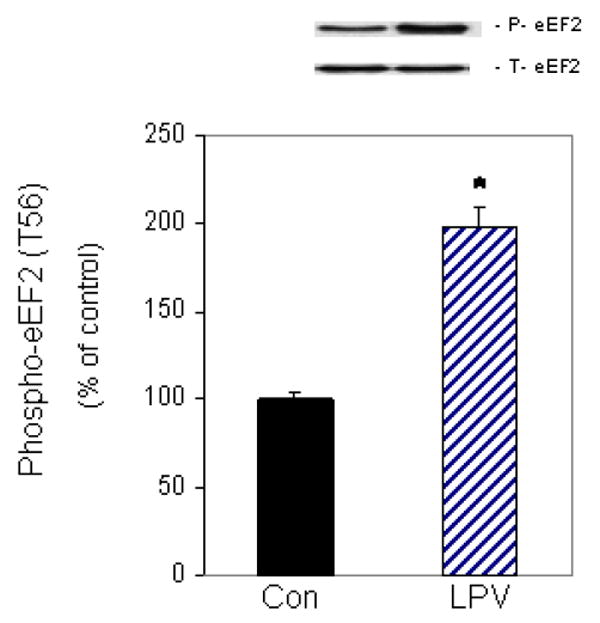
C2C12 myocytes were incubated in the presence or absence of LPV (10 μM) for 15 min. Cell extracts were collected and analyzed via Western blotting using anti-phospho-eEF2 (T56) and total eEF2 antibodies. Results for phosphor-eEF2 are normalized to total eEF2 and are expressed as a percentage of basal control levels. Each bar graph represents mean ± SE of 6 independent experiments consisting of 3-4 replicate samples per experiment. * P< 0.05 versus control values.