
Figure 1.
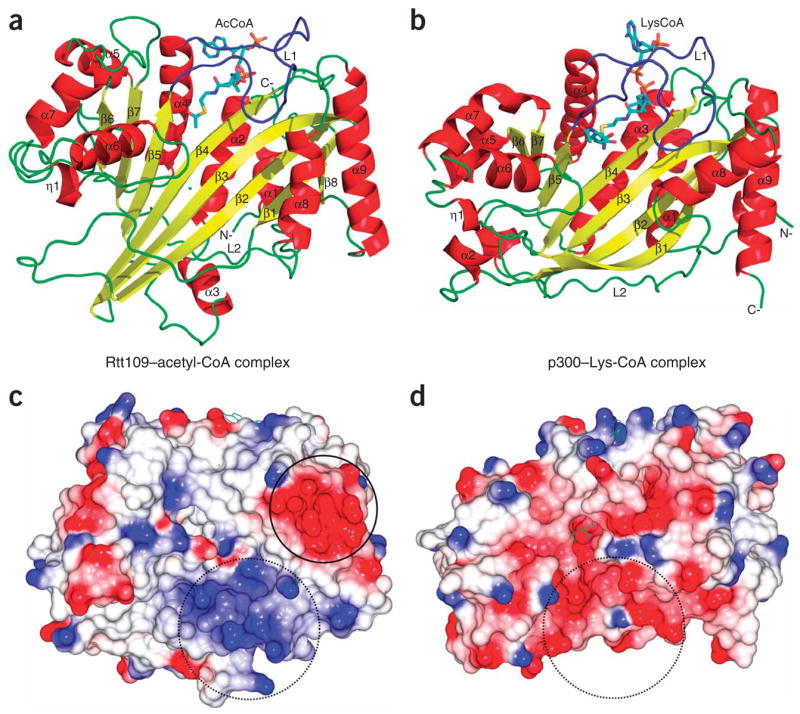
Overall structure of the Rtt109–acetyl-CoA complex and its relationship to p300. (a) Cartoon of the Rtt109 structure with bound acetyl-CoA. Secondary structural elements are numbered with the acetyl-CoA cofactor shown in stick representation in CPK coloring (with carbon atoms in aqua), with “N-” and “C-” denoting the respective polypeptide termini. (b) Cartoon of the p300 structure with bound Lys-CoA inhibitor. (c) Electrostatic surface of the Rtt109 HAT domain with blue, red and white representing electropositive, electronegative and neutral areas, respectively. (d) Electrostatic surface of the p300 HAT domain shown on the same scale as in c. Open circles in c and d highlight the divergent surface-charge features proximal to the lysine binding pockets. Closed circle highlights a conserved acidic patch on Rtt109 homologs.