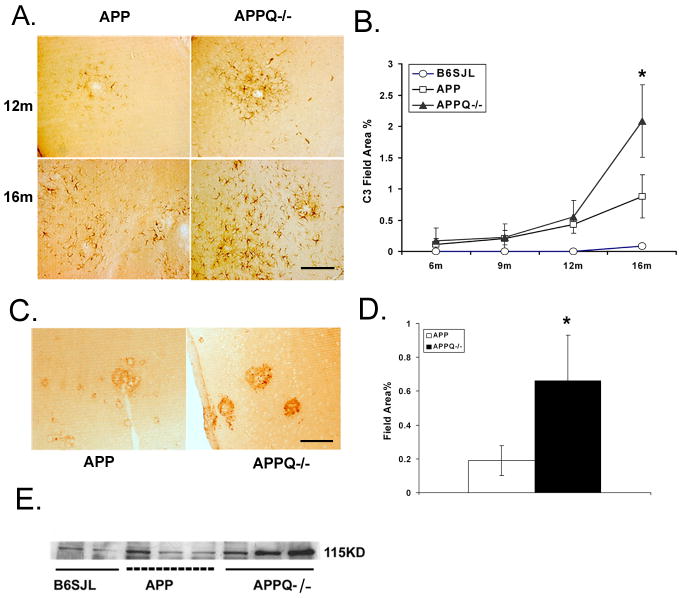
Figure 5. C3 immunoreactivity is greater in APPQ−/− than in APPQ+/+.
Anti-C3 staining (HBT) in cortex of APPQ+/+ (left) and APPQ−/− (right) at 12m and 16m shows increased cellular immunoreactivity in APPQ−/− mice. Scale bar: 50 μm. B. Quantification of C3 immunoreactivity in cortex and hippocampus in APPQ+/+ (-□-), APPQ−/− (-▲-) and B6/SJL (-○-) at 6, 9, 12, 16 mo (6m n=3; 9m n=3; 12m n=4; 16m n=4 each genotype) shows significantly higher levels of C3 (anti-C3, HBT) in APPQ−/− than APP at 16 months (* p<0.0 2). Data points are group means ± SD. C. Anti-C3c (Lambris 2/16) staining in 16m APPQ+/+ (left) and APPQ−/− (right) in plaque-like structures. Scale bar: 50 μm D. Image analysis of anti-C3c (2/16) staining. (n=3 animals each genotype; * p < 0.05). Data shown are group means ± SD. E. Western blot of brain extracts from B6/SJL, APPQ+/+ and APPQ−/− at 16 months probed with anti-mouse C3 antibody (Cappel) shows greater reactivity to anti native C3α chain (115,000 Mr) in the APPQ−/− animals.

