
Fig. 2.
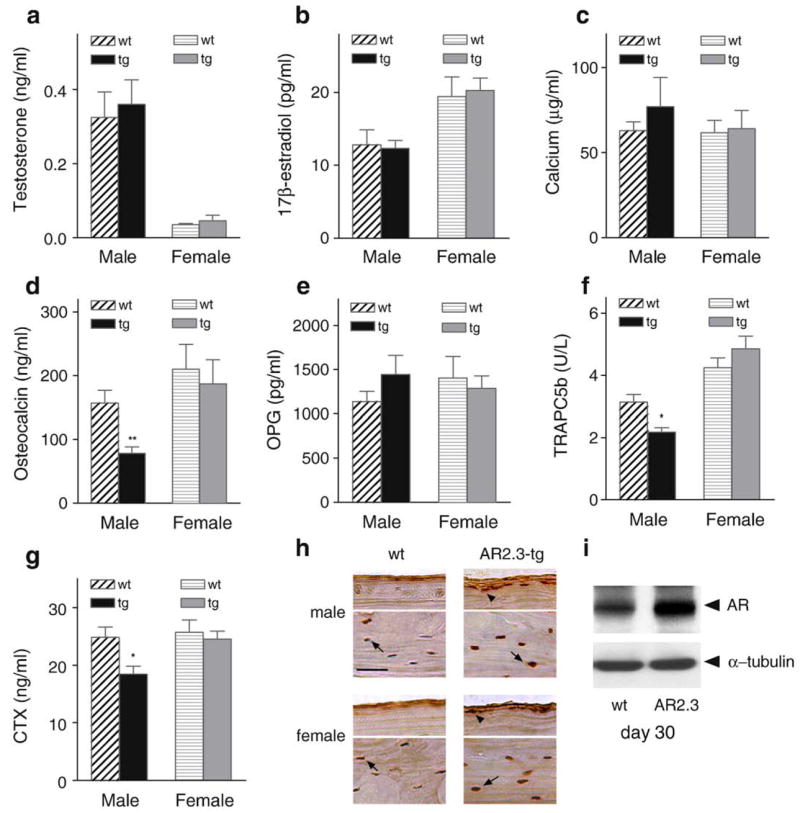
Phenotypic characterization of serum markers and AR overexpression in AR2.3-transgenic animals. Comparisons were performed between wild-type littermate control (wt) and AR2.3-transgenic (AR2.3-tg) animals. Serum from 2-month-old mice was analyzed to determine levels of hormones and markers of calcium metabolism. Assays were performed in duplicate by RIA for 17β-estradiol or EIA for testosterone, OPG and intact mouse osteocalcin, and for calcium by the colorimetric cresolphthalein-binding method. a. Testosterone. b. 17β-estradiol. c. Calcium. There were no statistical differences between the genotypes for 17β-estradiol, testosterone or calcium levels. Values are expressed as mean±SEM, n=6–17. d. Osteocalcin. e. OPG. f. TRAPC5b. g. CTx. Osteocalcin, TRAPC5b and CTx were all significantly reduced in male AR2.3-transgenic mice. Values are expressed as mean±SEM, n=3–8. *P<0.05; **P<0.01 (vs. gender-appropriate wild-type control). h. Immunohistochemical analysis of AR levels in calvaria isolated from 2-month-old mice. Sections were subjected to immunohistochemical staining after demineralization and paraffin embedding. For each sex, the top panel represents a section at the calvarial surface to focus on osteoblasts (arrowheads) while the bottom panel represents a section through the center of the bone to show osteocytes (arrow). Representative sections are shown. AR abundance was visualized with rabbit polyclonal antisera for male and female mice from wt and AR2.3-tg mice. AR is brown and the nucleus is purple after DAB incubation and counterstaining with hematoxylin. Scale bar=50 μm. i. AR levels by Western blot analysis during ex vivo differentiation of calvarial osteoblasts derived by collagenase digestion from wild-type or AR2.3-transgenic mice. Analysis was performed at day 30 in mineralizing cultures. Control for loading was characterized by α-tubulin levels. (For interpretation of the references to color in this figure legend, the reader is referred to the web version of this article.)