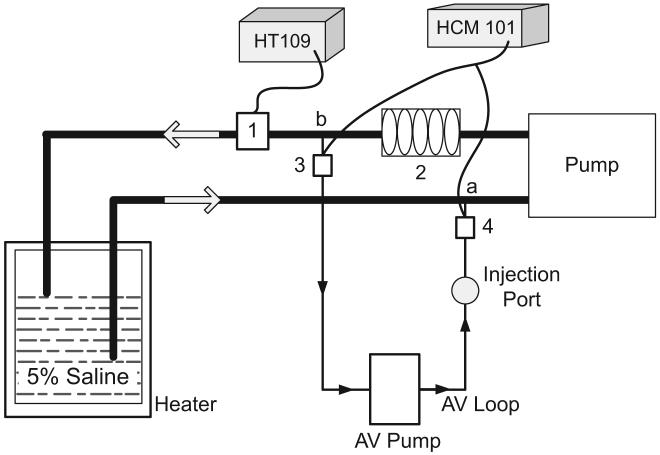
Figure 4.
Schematic of the in vitro model. 1, transit time clamp-on flow sensor connected to HT109 measuring the total flow; 2, mixing chamber containing one to five bubble traps to simulate the total end-diastolic volume; 3 and 4, arterial and venous flow/dilution clamp-on sensors, respectively; a, venous catheter location for injection; b, arterial catheter location for withdraw. Catheters and the mixing device used in the saline jar are not shown in the figure. AV, active circulation volume.

