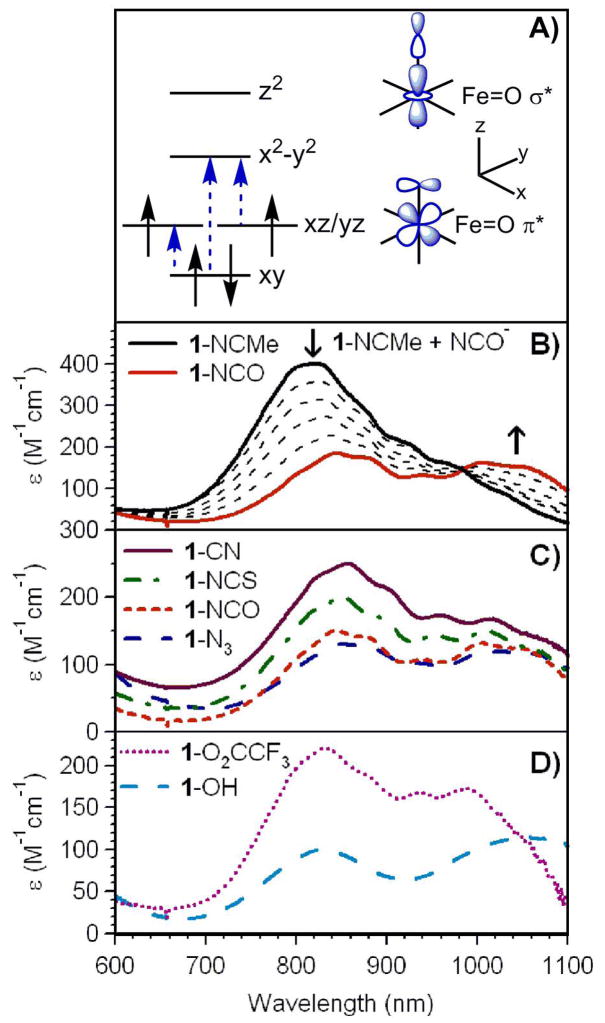
Figure 2.
Near-IR regions of the electronic absorption spectra of [FeIV(O)(TMC)(X)]2+/+ complexes in MeCN at −40 °C. A) General FeIV 3d orbital splitting diagram for nonheme oxoiron(IV) complexes, with the three near-IR d-d transitions identified through MCD studies (ref. 62) indicated with dashed arrows. B) Near-IR spectrum of 4 mM [FeIV(O)(TMC)(NCMe)]2+ (1-NCMe) and spectral changes following the addition of 10 equivalents of NBu4NCO. C) Spectra of 4 mM [FeIV(O)(TMC)(CN)]+ (1-CN), [FeIV(O)(TMC)(NCS)]+ (1-NCS), [FeIV(O)(TMC)(NCO)]+ (1-NCO), and [FeIV(O)(TMC)(N3)]+ (1-N3). D) Spectra of 2 mM [FeIV(O)(TMC)(O2CCF3)]+ (1-O2CCF3) and 8 mM [FeIV(O)(TMC)(OH)]+ (1-OH).

