
Figure 8.
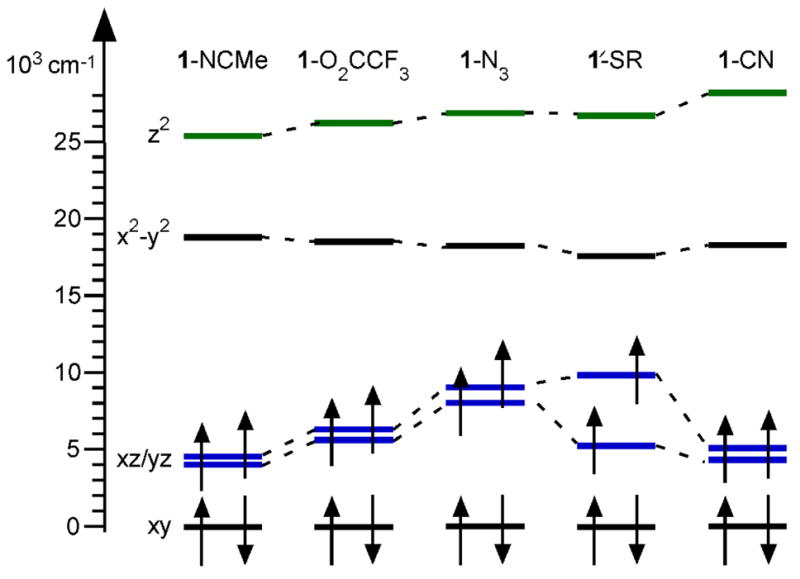
Molecular orbital splitting diagram for [FeIV(O)(TMC)(X)]2+/+ (1-X) complexes based on DFT computations using the PBE0 hybrid functional. For comparison, the orbital energies are all plotted relative to the spin-up dxy MO of each complex. MOs involved in FeIV=O π- and σ-antibonding interactions are highlighted in blue and green, respectively.