Figure 3.
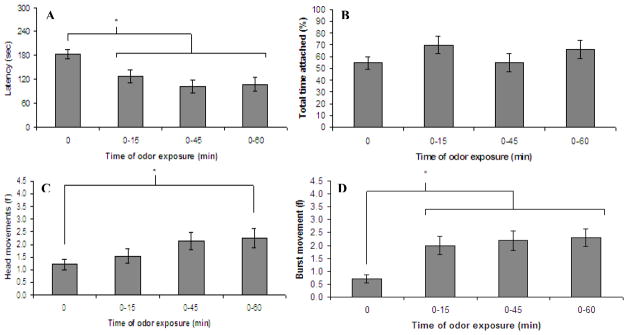
Experiment 2. These graphs illustrate the mean (± SE) of a) latency to attach to and b) percent total time attached to a scented surrogate nipple as a function of duration of prior odor exposure. Also depicted are the mean (± SE) values of c) head movements and d) burst movements during the first minute of presentation of the scented surrogate nipple. * indicates p <.05

