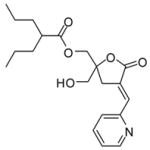
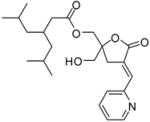
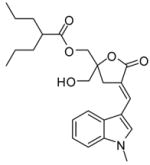
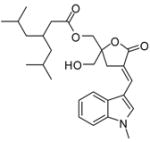
Table 4.
Affinity ratios between PKCα and RasGRP3 for compound 12m-E versus 12s-E and compound 12r-E versus 12t-E.
| Compound | SlogP | PKCα Ki (nM) | RasGRP-3 Ki (nM) | Ratio PKCα/RasGRP-3 |
|---|---|---|---|---|

12m-E |
2.9026 | 86.3 ± 0.7 | 0.72 ± 0.1 | 119 |

12s-E |
3.7847 | 4.6 ± 0.5 | 0.20 ± 0.04 | 23 |

12r-E |
4.3585 | 29.7± 1.1 | 0.18± 0.03 | 165 |

12t-E |
5.2406 | 14.8± 1.0 | 0.70± 0.02 | 21 |
