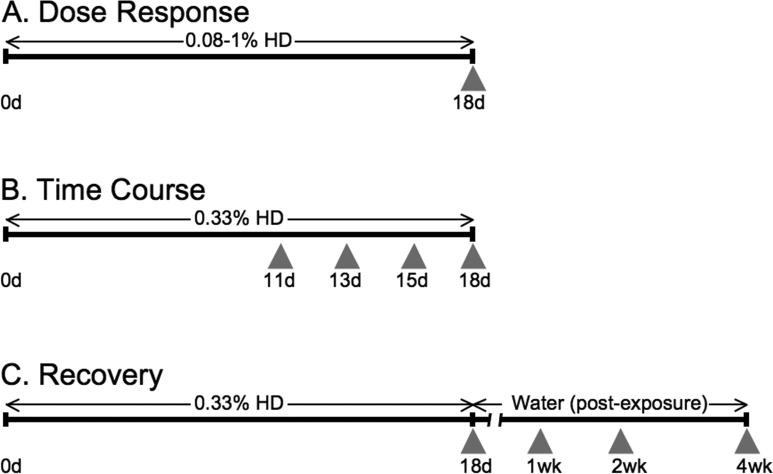
Figure 1.
Timeline and experimental design. For Dose Response experiments (A), animals were treated with 0.08, 0.14, 0.21, 0.33, 0.625, or 1.0% HD for 18d. For Time Course experiments (B), animals were exposed to 0.33% HD and sacrificed at 11, 13, 15, and 18d. For Recovery experiments (C), animals were given 0.33% HD for 18d and then switched to water and sacrificed 1, 2, and 4 weeks post-exposure. Gray arrowheads indicate sacrificing timepoints. The duration of HD or water administration is indicated by horizontal arrows above the timeline.

