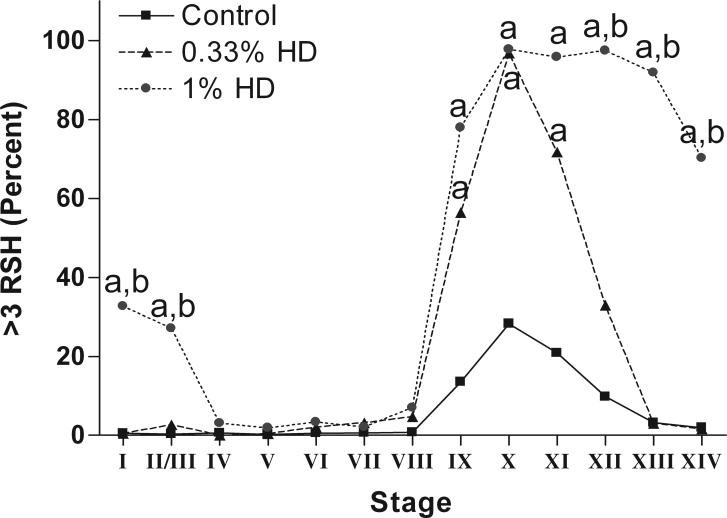
Figure 7.
The percentage of seminiferous tubules at each stage with greater than three total RSH in control and HD-treated testes. Rats treated with 0.33% HD for 18d are significantly different from control at stages IX-XII; rats treated with 1% HD for 18d are significantly different from controls at stages IX-II/III, and different from 0.33% HD treated rat at stages XII-II/III. Significant difference from control is indicated by an “a” and significant differences between 0.33% and 1% HD is indicated by a “b”. See Supplemental Table 2 for SEM values at each point.

