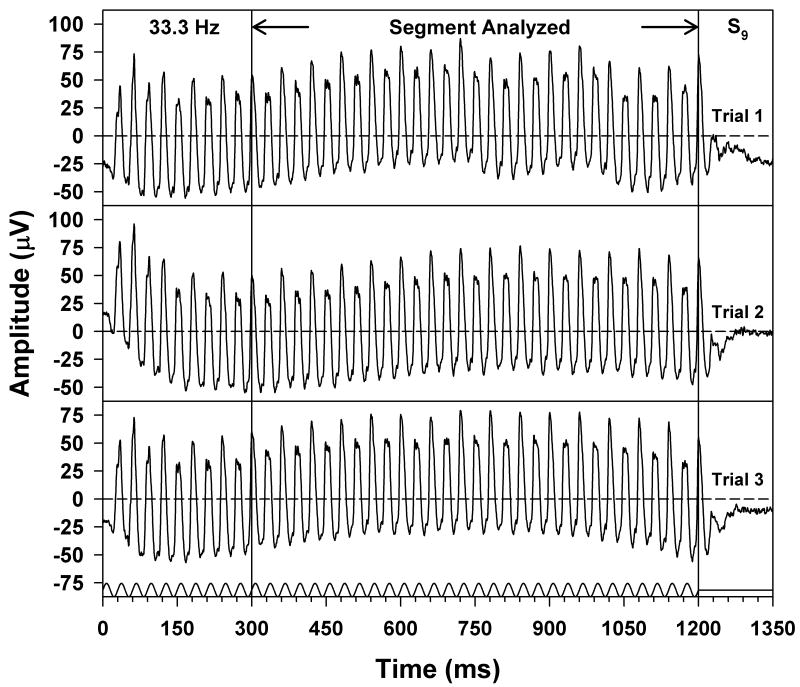
Figure 1.
Individual ERG responses of S9, obtained at a stimulus frequency of 33.3 Hz, with the stimulus waveform given below the responses and the x-axis labeled in multiples of the stimulus period. Three ERG waveforms are plotted to illustrate reproducibility, and the segment of the waveforms that was used for analysis is indicated by the arrows and vertical lines. Horizontal dashed lines represent the waveform means.

