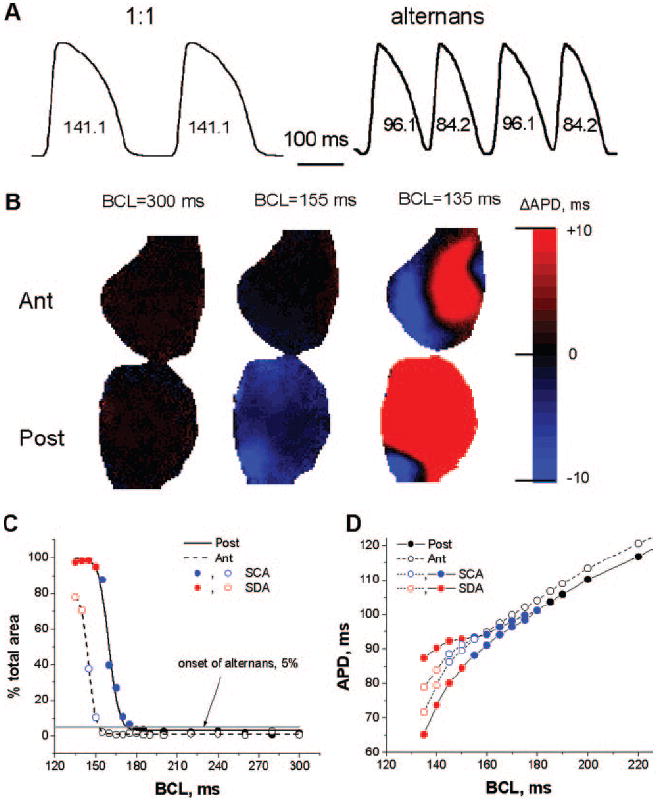
Figure 1.

Formation of APD alternans in the rabbit heart. A, Typical single-pixel optical action potentials during 1:1 responses and alternans. B, Examples of steady-state alternans maps on posterior (Post) and anterior (Ant) surfaces for 3 different BCLs. C, Percentage of posterior (solid line) and anterior (dashed line) surfaces occupied by 1:1 responses (black), SCA (blue), and SDA (red). The onset of alternans was determined as 5% of the total area (gray horizontal line). D, Mean steady-state APD as a function of the BCL for posterior (●) and anterior (○) epicardial surfaces. Black, blue, and red represent 1:1 responses, SCA, and SDA, respectively.
