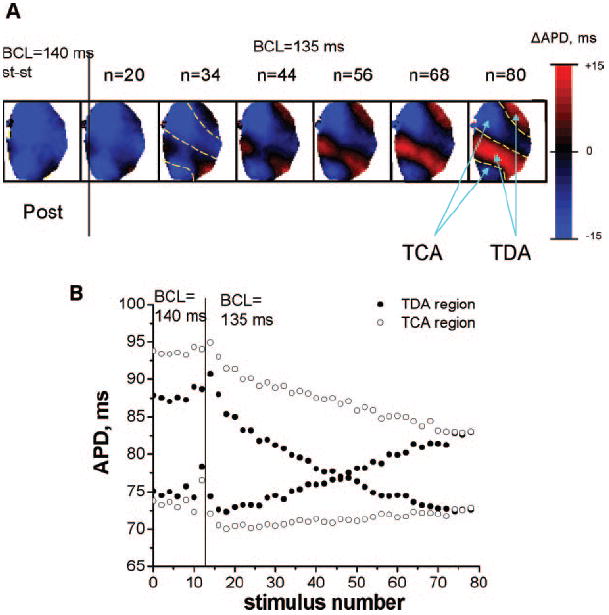
Figure 2.

Temporal evolution of SDA. A, Examples of alternans maps from the posterior (Post) surfaces showing the development of SDA after the BCL was changed from 140 to 135 ms. The stimulus number is shown on top of each map. Note the eventual development of TCA and TDA regions indicated by the blue arrows and contour lines. The same contour lines are shown at 34 stimuli for comparison. B, Change in average APDs in the TCA (○) and TDA (●) regions (see n=80 stimuli, Figure 2A) at a BCL of 135 ms as the stimulus number increases.
