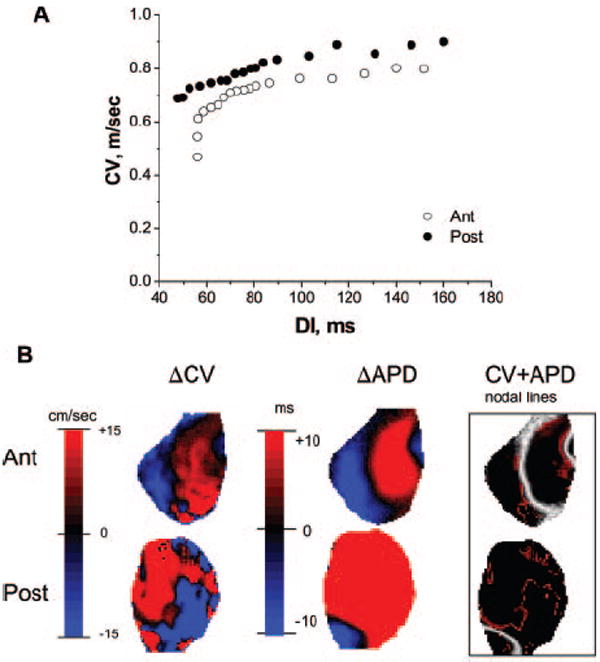
Figure 5.

CV restitution and alternans. A, Mean CV restitution calculated for anterior (Ant; ○) and posterior (Post; ●) surfaces in a representative experiment. B, Steady-state alternans maps for posterior and anterior surfaces at a BCL of 135 ms showing alternans in CV (left), alternans in APD (middle), and superposition of their nodal lines (right). The APD and CV nodal lines are shown in white and red, respectively. DI indicates diastolic interval.
