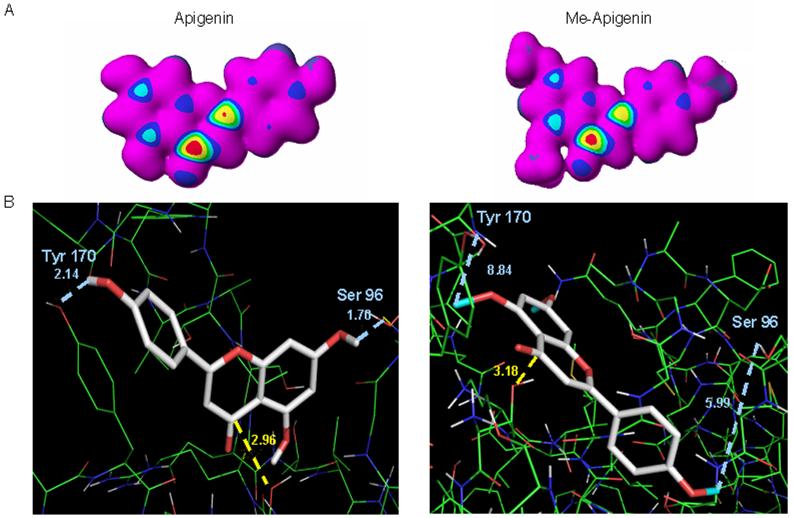
Fig. 5.
The nucleophilic susceptibility and docking poses of unmethylated and methylated flavonoids. A. Molecular orbital energy analysis is demonstrated by drawing an electron density isosurface colored by nucleophilic susceptibility. The red center signifies the highest area of susceptibility. B. Apigenin and methylated apigenin are represented by the stick structure (see also Fig. 1 for description) and the colors are representative of atom type (carbon, gray; oxygen, red, methyl, light blue). The dotted line in yellow represents the distance in angstroms to Thr 1 of β5 subunit and is indicative of potential nucleophilic attack. The dotted lines in light blue represent potential hydrogen bond formations with surrounding amino acids in the S1 pocket. The pose shown represents the most frequently adopted conformation of the molecule.

