
Figure 4.
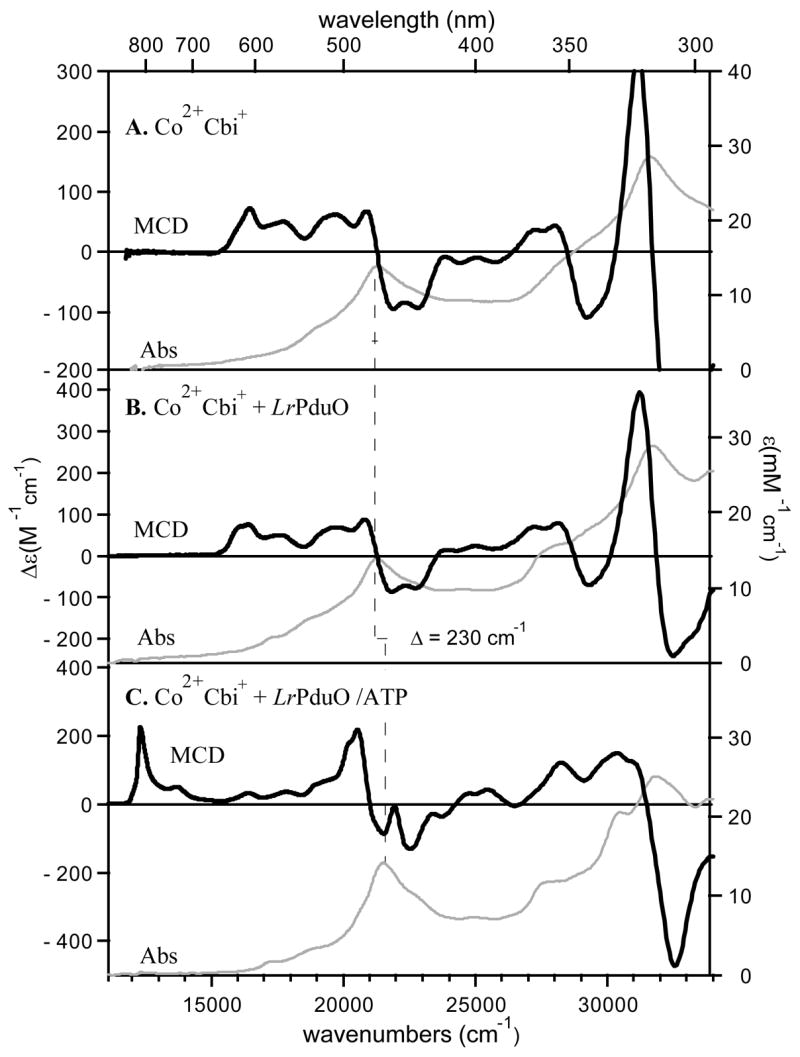
Abs (gray traces, right axis) and 7 T MCD (black traces, left axis) spectra collected at 4.5 K of (A) free Co2+Cbi+, (B) Co2+Cbi+ in the presence of LrPduO, and (C) Co2+Cbi+ in the presence of the LrPduO/ATP complex. The peak position of the dominant Abs feature (the α-band) is indicated by the vertical solid line.