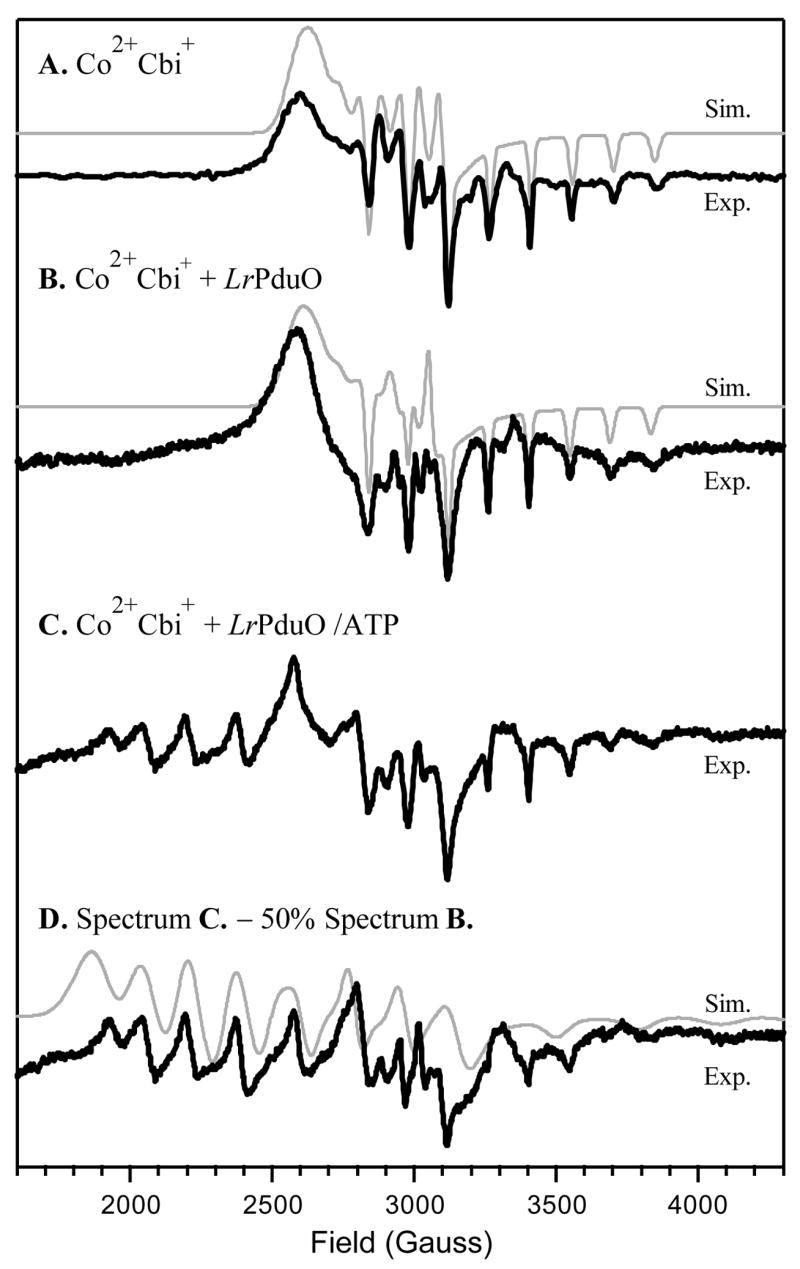
Figure 5.

EPR spectra collected at 20 K of (A) free Co2+Cbi+, (B) Co2+Cbi+ in the presence of LrPduO, and (C) Co2+Cbi+ in the presence of the LrPduO/ATP complex. Spectrum D was obtained by subtracting 50% of spectrum B from spectrum C. Spectral simulations (thin lines) were performed using the parameters provided in Table 3.
