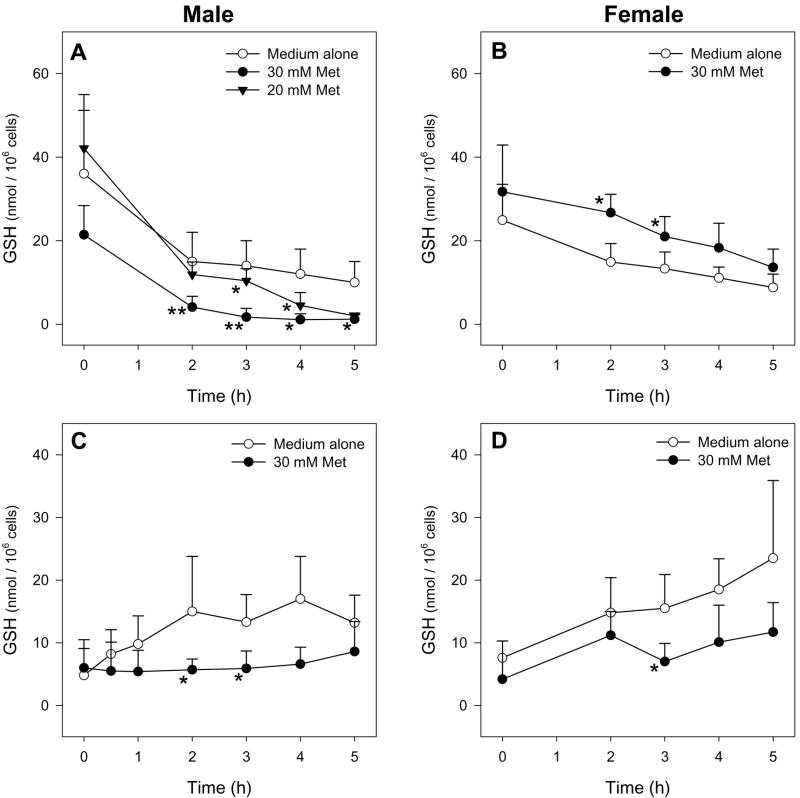
Figure 3.
Time course of intracellular (A, B) and medium (C, D) GSH levels of male (n=7 for 20 mM Met, n=4 for 30 mM Met) or female (n=3) hepatocytes exposed to medium alone or medium spiked with Met. The symbol * indicates values that were significantly different than cells incubated with medium alone (*p<0.05, **p<0.01).

