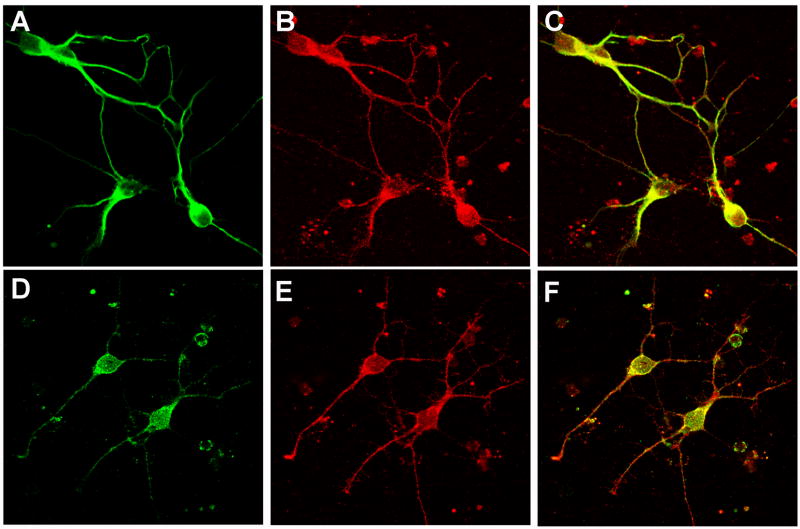
Fig. 3. Confocal imaging of S100B.
Upper row, representative confocal fluorescence images depict immunoreactivity for MAP2 (A) and S100B (B) in neostriatal neurons. In the merged image (C) pixels containing immunoreactivity for both S100B and the neuronal marker MAP2 appear as yellow. Lower row, representative confocal fluorescence images depict immunoreactivity for D2 (D) and S100B (E) in neostriatal neurons. In the merged image (F) pixels containing immunoreactivity for both S100B and the D2 receptor appear as yellow.

