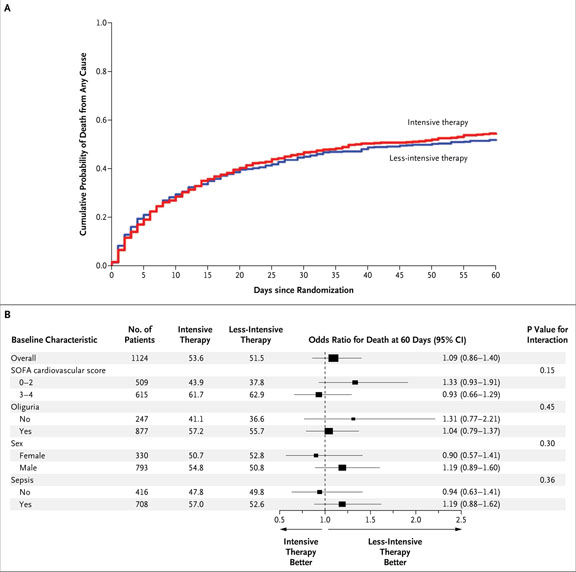
Figure 2. Kaplan–Meier Plot of Cumulative Probabilities of Death (Panel A) and Odds Ratios for Death at 60 Days, According to Baseline Characteristics (Panel B).
Panel A shows the cumulative probability of death from any cause in the entire study cohort. Panel B shows odds ratios (and 95% confidence intervals [CI]) for death from any cause by 60 days in the group receiving the intensive treatment strategy as compared with the group receiving the less-intensive treatment strategy, as well as P values for the interaction between the treatment group and baseline characteristics. P values were calculated with the use of the Wald statistic. Higher Sequential Organ Failure Assessment (SOFA) scores indicate more severe organ dysfunction. There was no significant interaction between treatment and subgroup variables, as defined according to the prespecified threshold level of significance for interaction (P = 0.10). Sex was not recorded for one patient receiving lessintensive therapy.

