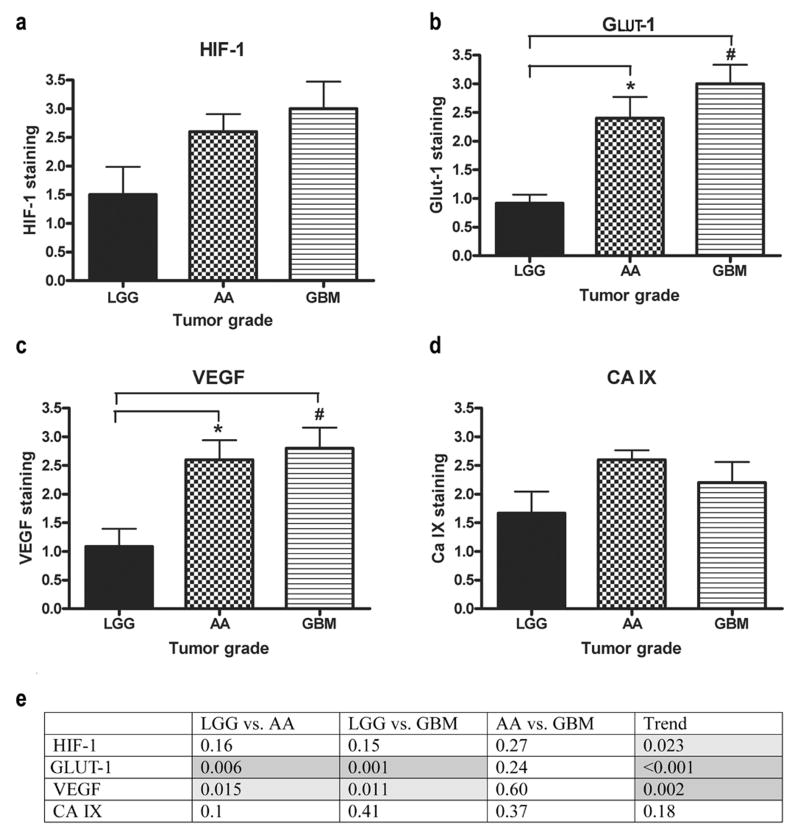
FIGURE 2.
HRMs compared across tumor grades. (a) No significant differences were seen when HIF-1 staining was compared across tumor grades. (b) GLUT-1 staining was significantly different when LGG was compared with AA and GBM. (c) VEGF staining was significantly different when LGG was compared with AA and GBM. (d) No significant differences were seen when CA IX staining was compared across tumor grades. (e) Table of p-values of HRMs compared across tumor grades and the p-values for the trends (light grey, p<0.05; dark grey, p<0.01).

