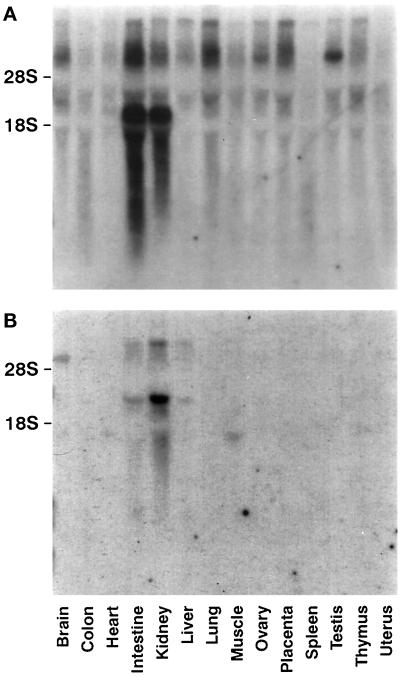
Figure 6.
Tissue distribution of rBAT and b0,+AT in the mouse. (A) Northern blot analysis of mouse tissue RNAs shows a major b0,+AT transcript of ∼2 kb specifically expressed in intestine and kidney. Weaker signals at a higher molecular weight (∼4.5 kb and/or ∼6 kb) can be seen in most other tested tissues. (B) The major rBAT transcript (∼2.5 kb) is also clearly visible only in kidney and intestine and is only slightly visible in liver on the original autoradiograph. A higher-molecular-weight transcript (∼4.5 kb) is visible only in brain.

