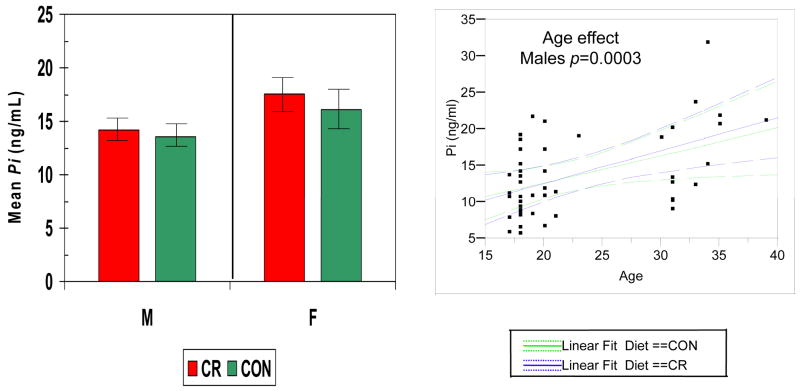
Figure 3.
Serum IgG antibody levels to P. intermedia (Pi) in nonhuman primates categorized based upon gender and diet (LEFT). The bars denote the mean levels of each mediator and the vertical brackets denote 1 standard error. (RIGHT) Antibody levels related to age classified according to diet (green –control; blue – calorie restricted). Dashed lines denote 95% confidence interval.

