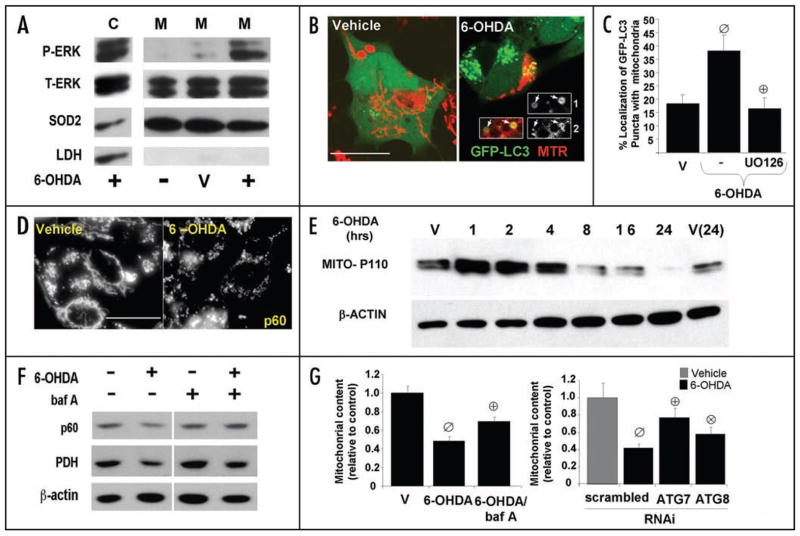
Figure 2.
6-OHDA promotes mitochondrial ERK1/2 phosphorylation and mitophagy. (A) Representative Western blot showing p-ERK1/2 in cytosolic (C) and in mitochondrial fractions (M) of SH-SY5Y cells treated with 6-OHDA for 4 hrs. compared to vehicle treated cells (V). (B) Representative confocal images of MitoTracker Red-stained (MTR) SH-SY5Y cells stably expressing GFP-LC3, treated with vehicle control or with 6-OHDA for 4 hrs. The insets, which have been enlarged by 50%, show the merged and separate channels for GFP-LC3 (1) and MTR (2) from a second 6-OHDA treated cell. (C) Quantification of the percent of GFP-LC3 puncta colocalizing with mitochondria. Bar graph shows means ± s.e.m. (25–30 cells analyzed per condition) and is representative of at least 3 independent experiments ø:p < 0.005 vs. vehicle ⊕:p < 0.005 vs. 6-OHDA). (D) Representative epifluorescence images of cells treated with vehicle control or with 4 hours of 6-OHDA, then immunolabeled using an antibody specific for human mitochondrial antigen of 60 kDa (MITO-P60). Note that 6-OHDA induces mitochondrial fragmentation. Scale bars: 20 μm. (E) SH-SY5Y cells were treated with 6-OHDA or with vehicle control for different time points. Cells were analyzed for total protein levels of mitochondria by immunoblotting for mitochondrial human antigen of 110 kDa (MITO-P110) and reprobed for β-actin as a loading control. (F) SH-SY5Y cells were treated with vehicle or 6-OHDA in the absence and presence of bafilomycin-A, and analyzed by Western blot for levels of the 60 kDa mitochondrial membrane protein (p60), and the matrix protein pyruvate dehydrogenase (PDH). (G, left) SH-SY5Y cells transiently transfected with GFP were treated with 6-OHDA for 5 h in the presence or absence of balilomycin-A. Cells were fixed, and immunostained for mitochondrial human antigen of 60 kDa. The effects of 6-OHDA on mitochondrial content was analyzed by measuring the percent cellular area occupied by mitochondria in GFP transfected cells using a custom made NIH Image J algorithm. Data was normalized to basal mitochondria content exhibited by non-treated cells. The representative bar graph shows means ± s.e.m. (22–50 cells analyzed per condition) (ø:p < 0.0001 vs. untreated, ⊕:p < 0.005 vs. 6-OHDA). (G, right) After 3 days, cells co-transfected with GFP and with siRNA targeting human Atg7 or LC3 were treated with 6-OHDA for 5 h and analyzed using Image J as described above. Data was normalized to basal mitochondria content exhibited by cells treated with each respective siRNA and not receiving toxin. The representative bar graph shows means ± s.e.m. (22–50 cells analyzed per condition) (ø:p < 0.0005 vs. untreated, ⊕:p < 0.0005 vs. scrambled siRNA with 6-OHDA, ⊗:p < 0.05 vs. scrambled siRNA with 6-OHDA).

