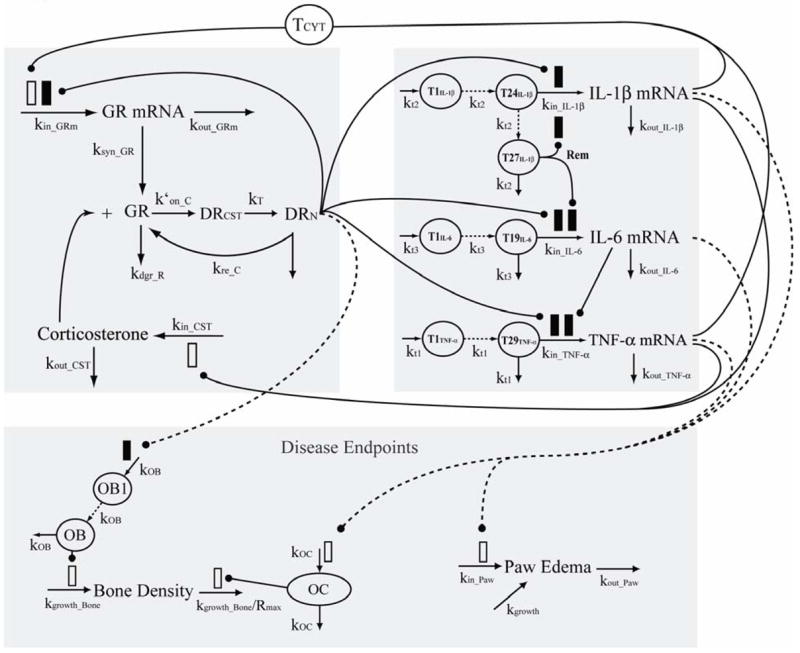
Figure 2.

Model schematic for corticosteroid and cytokine inter-regulation during arthritis progression. Parameters and symbols are explained in the text and tables. Lines with arrows indicate conversion to or turnover of the indicated responses. Lines ending in closed circles indicate an effect is being exerted by the connected factors. Open and solid boxes differentiate between stimulatory and inhibitory effects. Dashed lines depict pathways of molecular biomarker influence on disease endpoints. The upper left panel depicts factors related to corticosteroid dynamics. The upper right panel depicts factors related to cytokine mRNA turnover. The lower panel indicates factors and processes relevant to the disease endpoints bone mineral density and paw edema.
