
Figure 5.
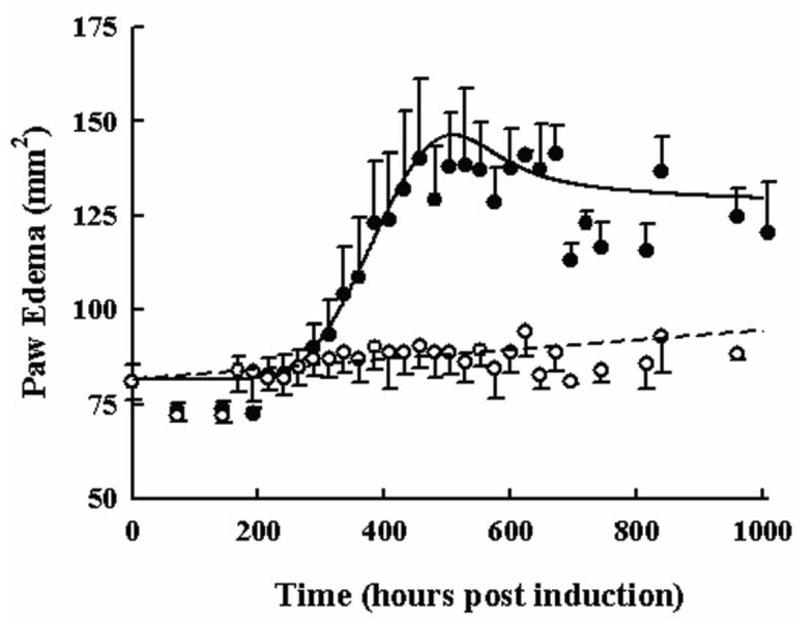
Time course of paw edema in arthritic and healthy rats. Black circles and the solid line depict the measured responses and model fitting for rats with CIA. Open circles and the dashed line show the measured responses and model fitting for rats with no disease. All data are plotted as mean ± one standard deviation.