
Figure 7.
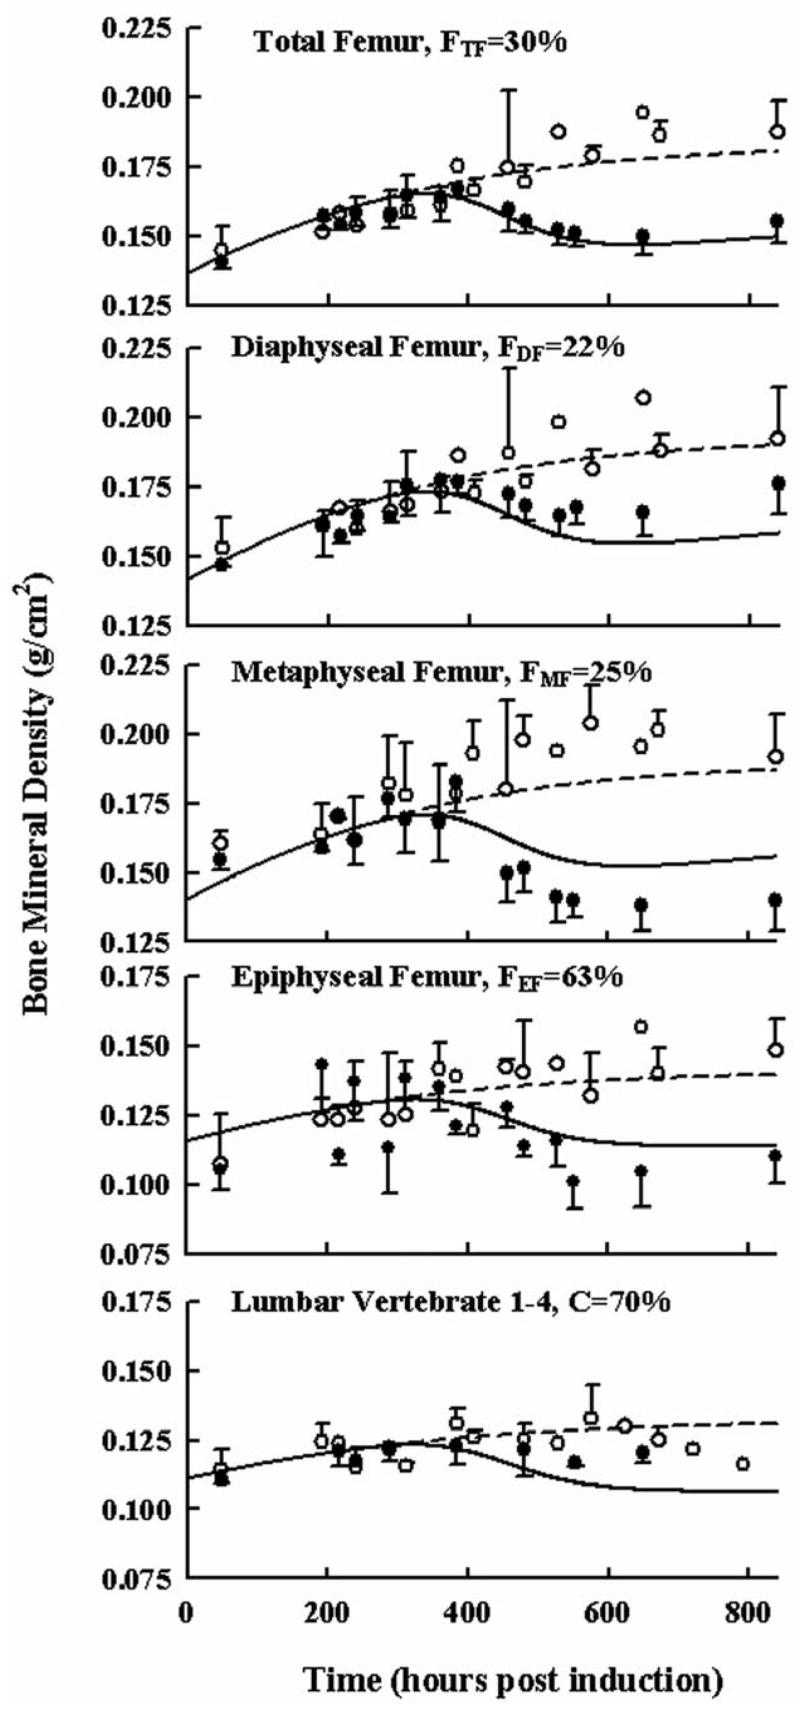
Time courses of bone mineral density in different regions of the rat femur and lumbar vertebrate in healthy (○) and arthritic rats (●). All observations are reported as mean ± one standard deviation. Model fittings are shown as a solid lines for diseased rats and short-dashed lines for data from healthy rats. The F value indicates the model-fitted percentage of cancellous bone in the specified region of interest.