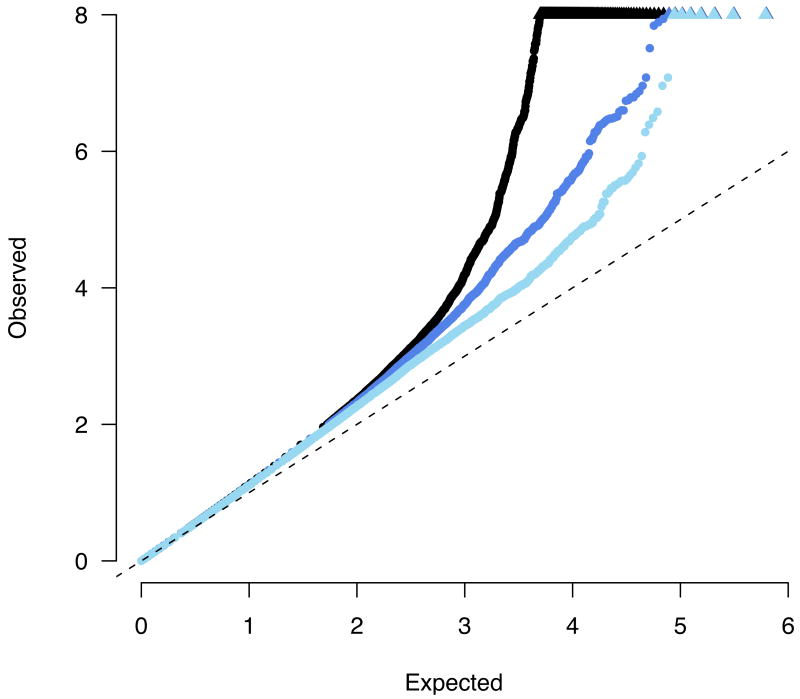
Figure 2.
A quantile-quantile plot of observed -log10 p values versus the expectation under the null. Black points represent the complete meta-analysis, with a substantial departure from the null at the tail (values > 8 are represented along the top of the plot as triangles). Dark blue points show the distribution after removing 11 previously published loci, demonstrating a still notable excess. Light blue points show the distribution after removing all 40 loci which replicate at least nominally. In all the cases the overall distribution is marginally inflated (λGC < 1.16).

