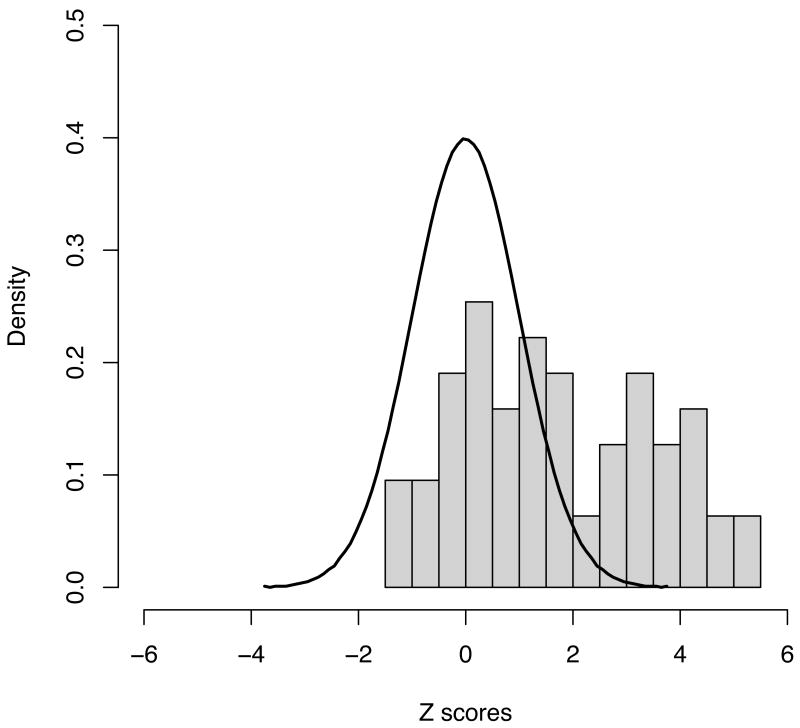
Figure 3.
Distribution of observed Z scores from the 63 novel regions explored, along with the expected distribution under the null (a standard normal with mean 0 and variance 1). Even setting aside the 21 regions reaching genome-wide significance, the distribution is highly skewed – 4 more results exceed a Z of 2 (1 would be expected by chance under the null) whilst none showed a Z of less than -2 (same expectation under the null) suggesting that even more of the regions investigated here are likely to constitute true positive associations when additional data become available.

