
Fig 3. Cytokine production by human lung and breast tumor cells treated with doxorubicin.
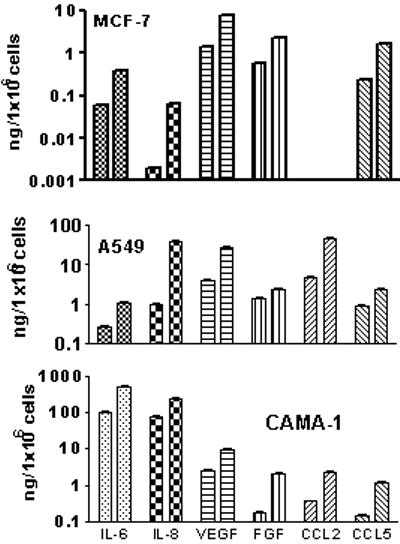
MCF7 and CAMA-1 breast tumor cells, and A549, non-small cell lung cancer cells were seeded into 96-well plates, six wells per group (5×10³cells/well). After 24h, media was changed and doxorubicin (0.125 μg/ml) was added. After three days, conditioned media were collected; cells were stained with Hoechst 33342 and counted using Cellomics Array Scan VTI. Concentrations of various TPFs in the supernatants were determined using multiplex immunobeads technology. Data presented as mean ± SE pg/1×106 cells. Only cytokines with a significant (p<0.05) drug-induced increased production are presented. Left columns for each cytokine show untreated control cells; right columns for each cytokine - doxorubicin-treated tumor cells.