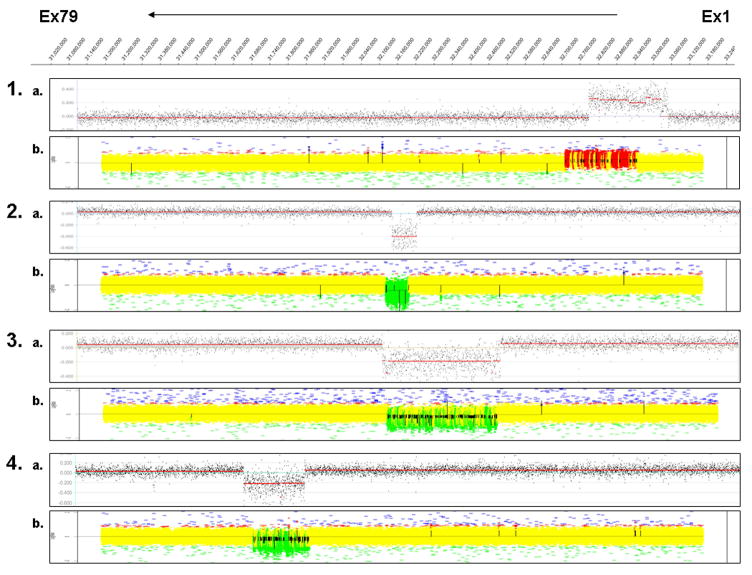
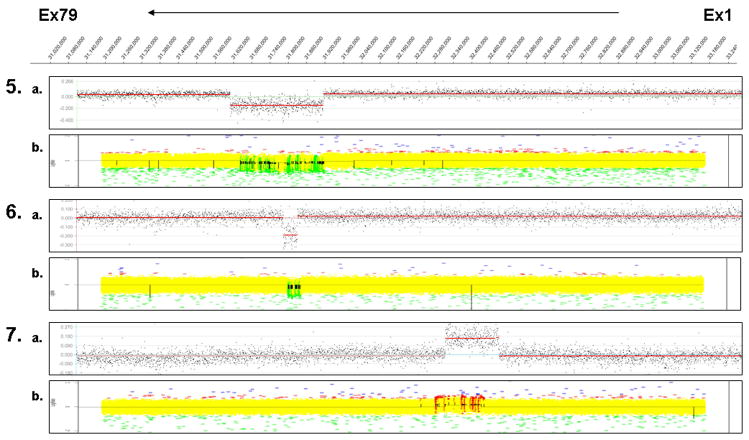
Figure 2.
Validation of targeted CGH dystrophin array for males and females. The dystrophin coordinates are represented at the top, with exon 1 to 79 from right to left. The representative array results shown here for males and females are displayed in the scatter plot. Each pair shows results of CGH analysis using NimbleGen DNACopy (A) and GLAD analysis (B). 1) 15 Mv - male with duplication of exons 2–4; 2) 5 Mv - male with deletion of exon 44; 3) 2 Mv - male with deletion of exons 17–44; 4) 8 Mv - male with deletion of exons 48–52; 5) 16 Fv - female with deletion of exons 46–55; 6) 20 Fv - female with deletion of exons 49–50; and 7) 23 Fv - female with duplication of exons 18–38.


