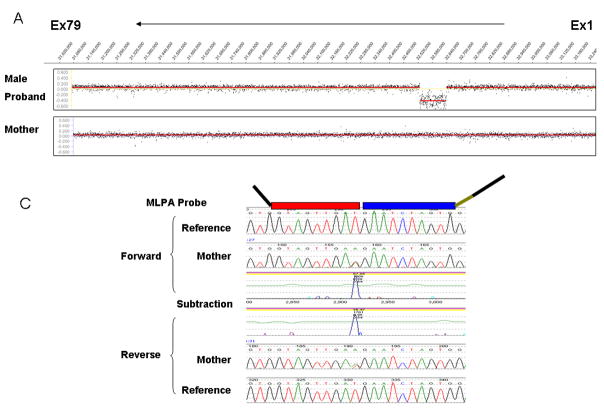
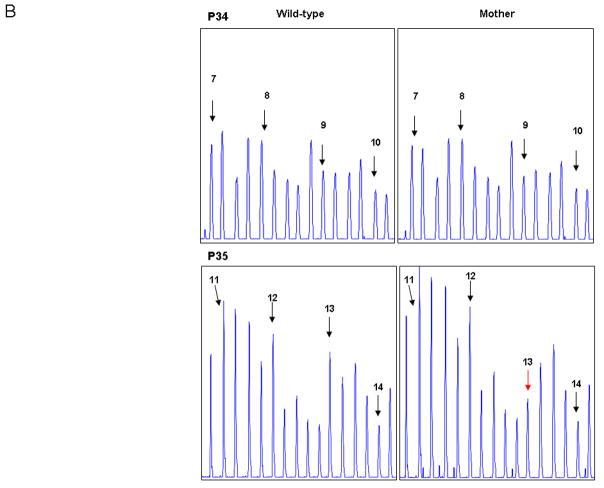
Figure 4.
CGH and MLPA analysis of exon 8–13 (c.650−?_1602+?del) familial deletion mutation. Panel A - Exons 1 to 79 are represented on the CGH scatter plot from right to left. Scatter plots shown are for CGH analysis on the male proband with deletion of exons 8–13 (above) and carrier testing for the proband’s mother for exons 8–13 showing no deletion of exons 8–13 (below). Panel B -Confirmatory analysis of the negative findings for the mother using MLPA showed no deletion of exons 8–12 and a deletion of exon 13. Exon peaks are marked with black arrows, and exon 13 is marked with a red arrow. Other peaks on the panel are internal controls for the MLPA reaction. Panel C - Subsequent sequencing of exon 13 on the maternal sample detected a SNP (c.1554T> A: p.D518E) where the MLPA probe binds. Presence of the SNP interfered with hybridization of the probe, giving the appearance of an exon 13 deletion.


